Monday, December 20, 2010

RSY XXIII: Sell TSH, LZ Dividend

Not much activity for the month of December in the RSY portfolio. Could almost say it is starting to be a lazy portfolio. LZ did provide a dividend of $36 for the 100 shares of LZ which was recorded on December 10th. RSY has not yet found another stock to add to the portfolio.

As mentioned in the last post of RSY, we should exit out of TSH gracefully, especially considering this is a lightly traded micro-cap stock. Given that it has been topping over $33 to $33.25 for brief periods, we should be able to exit at $32.99 if we are patient enough. RSY recommends a Sell 100 shares of TSH at a limit price of $32.99 {GTC}.

Also worth noting is that IVR, MRH, and NGPC all have their next ex-dividend date on the 29th of this month, and as such any further recommended rebalancing will probably occur after the first of the year. CODI shows some weakness in the charts, but RSY is still recommending a hold on the current 200 shares.

Labels: ,

Wednesday, December 15, 2010

A Macro View: Structural Rigidity in the Labor Markets?

On November 8th, I talked in terms of the ISM manufacturing report and structural rigidity {SR} at A Macro View: ISM October, More Structural Rigidity. SR, as I use it, is to describe the inflexibility of an economy to change from one state to another state. This is more than just the everyday changes in the markets with one firm gaining and another losing, but more to do with the long-term patterns and trends that change not only the market but in certain ways the society. A prime example was the changing of nearly every aspect of society to go from an agricultural society to an industrial society. For the US, we were in an enviable position that we could politically and economically absorb large quantities of labor from other countries. The result was that the social changes became less severe than other countries that had to "encourage" labor transfer to the factories. Some of that labor was forced out of farming by Inclosure Acts.

This in no way invalidates the concepts of demand side considerations with respect to the lackluster aggregate demand the US is now facing. Aggregate demand is made up of more than just consumption by consumers, business and government but also investments. How does society encourage this creative destruction through increased levels of investment? R.A. at The Economist explains this need to explore all the various angles at America's jobless recovery: Improving the discussion.
It should be possible to say both that Republican policies x, y, and z are foolish and that structural factors may be contributing to unemployment. When we arrive at the point that the latter statement must be downplayed because it detracts from the former, then we've seriously degraded the quality of the economic debate.
It also seems possible to say that both the Democratic policies that have been enacted or planned have been been foolish also and that demand side stimulants are also needed.

Structural Rigidity in the Labor Markets, or not?
Paul Krugman provides a starting point in discussing these structural employment issues at Structure of Excuses, where he links to two papers that explore these issues further. The first is an EPI briefing paper #279 entitled with link to Reasons for Skepticism About Structural Unemployment. The second one is a paper from the Roosevelt Institute entitled with link to The Stagnating Labor Market. Mike Konczal also explains some of their {along with Arjun Jayadev} findings at 1: Dropping Out Of The Labor Force and at 2: What Can the Employed Tell Us About the Unemployed?

What Can the {Under} Employed Tell Us About the Unemployed?
Before discussing the second paper on "Stagnating Labor Market", it is important when looking at all the data to ask whether it gives a complete view of the market or only one slice of it. In other words, is there enough data to make a framework for what the economy looks like, or is it just a certain set of data points that may mask and hide the real effects on the economy.

The first post by Konczal presents two important points. The first is that a worker is more likely to end up dropping out of the labor force than being hired, which is affecting the long-term unemployed the most. The second is that people that are deciding to enter the labor force are more likely to join the ranks of unemployed than employed. This is directly related to young people not being able to find a job when finishing their various levels of education. Sometimes they can postpone that decision to join the labor force like going to college, but at some time, that must end also. Although this is not a complete picture of all the factors, this does point to one way that the economy may be suffering structural rigidity, and that is through the minimum wage laws. Wages tend to be sticky especially in the downward direction especially by raising the minimum wage rates like this:
The act raises the federal minimum wage in 3 increments: to $5.85 per hour 60 days after enactment (2007-07-24), to $6.55 per hour 12 months after that (2008-07-24), and finally to $7.25 per hour 12 months after that (2009-07-24). Fair Minimum Wage Act of 2007

It is also interesting to note the Great Recession lasted from December 2007 until June 2009. This is not to say there is a causal relationship but it does make it harder for young people or workers with limited skill sets to find employment at the entry level positions. Even if job applicant is graduating from college, businesses still desire to have some work experience to see if potential employers can handle even rudimentary job responsibilities.

The first post was mostly a look at how bad the labor market is performing now, and the second gets more into the questions of structural rigidity in labor markets (links 1 & 2 above). The writers of the paper provide an unique way of looking at the employment data by looking at the movements of underemployed workers {working less than full-time but desire full time}. They use that approach for two reasons: the first being "skill" sets, as if a person is qualified for the first hour but not full time position then it must be related more to economic factors; the second being that unemployment compensation may alter an workers decision to enter/reenter the work force. Both are good reasons for picking these data sets, but with some caveats. For the skills set, there could be other reasons for the mismatch as employers are adding more part-time workers to build up excess capacity now, but this requires that we assume that not all businesses face the same set of incentives. Talking about incentives, it seems reasonable to say that extending benefits changes people's incentives and thus changes their behavior. The question is an analytical one though.

The first set of data they consider is to look at the part time workers claiming underemployment for economic reasons. The major change of the overall economic reasons has been mostly increased due to the category of slack working conditions. There could always be a bias as this is simply self-reported work situations and they may not know the exact reasons for underemployment from their boss.

The next data sets they look at is comparing the graphs of underemployment rates of first the finance and construction sectors and then non finance and construction sectors and finally across 9 occupations. The graphs are quite similar in appearance and make a good point about not affecting the finance and construction sectors any more than non sectors. It might be helpful to even get a finer detail on the sectors and especially the occupations. They then break this data down in a table comparing average underemployment during 2000-2007 and 2010, across 13 sectors and 9 occupations. The use of ratios instead of just calculating the percentage change seems odd. It is a lot easier to hide the variance when using the ratios. For example the sectors had a range of percent change from 44% to 182% where the ratios were expressed as 1.44 to 2.82.

But I can't help from thinking that instead of constant increases across the sectors and occupations {around double according to the writers} that we should see convergence of rates across them. Take for example a worker looking for a job, would he look for a place that had over 15% underemployed in the work force as in construction and extraction, or just over 2.5% in management? So when looking at the sector data we see that even though mining started out the lowest in underemployment, it gained the least amount to just 44% increase.

It nearly is conflicting data when construction and extraction had the highest level of underemployment as occupations go, but then mining had the lowest in sectors. It could just be too broad of categories to give us fine enough details. The mining sector number does indicate that the US could have a structural rigidity in this sector. More data would need to be examined for that conclusion though.

Overall, the paper brought some interesting theories out and provided reasons to support more of the theory of inadequate aggregate demand. There are bound to be many different ways to slice the structural rigidity problem and so no one set of data will provide all the answers. So areas to look further might be the effects of minimum wage on structural rigidity and also the extraction side of the economy including mining.

Skepticism About Structural Unemployment
Lawrence Mishel, et al present the paper entitled
Reasons for Skepticism About Structural Unemployment. They nearly admit that their paper is a process of "critiquing a straw man" and they do this by talking in terms of our "unemployment problem is primarily structural". They do provide a summary of policy implications if structural rigidity is preventing an economic recovery in the employment markets in the following passage.
The policy implications of a finding that our high unemployment is primarily structural are that: (1) it would be foolhardy to use further demand management (fiscal stimulus, either tax cuts or increased spending, or monetary policy) to lower unemployment; and, (2) the appropriate policy is to offer education and training to the unemployed to help them make a transition to new occupations and sectors.

Those ideas are not mutually exclusive and are more complementary. A jobs training policy would in fact act as a stimulus and create demand in certain sectors of the economy. There would still be a need to maintain aggregate demand in the short term since the lag time could be quite long and any long term investment (including human capital) requires positive expectations about the future. What was foolhardy was that the stimulus bills did not include more along these lines of investment.

Let me critique a few straw men.
One of the ongoing stories about the current economic slump is lack of mobility of the work force, and the housing crisis certainly has not helped. Homeowners underwater may not be so readily or easily able to walk away from the current house and find another one in the place they wish to move to. Even if someone can walk away with little financial consequence does not mean that the family wants to be renters for some time. Mishel et al. use statewide data to deny this rigidity.
The disparity between states’ unemployment rates is indeed striking, ranging from 14.3% in Nevada to 3.6% in North Dakota.9 In fact, there are 11 states where the unemployment rate in June was less than 7.0%. Still, it is not as simple as a geographical mismatch, with high performing and low performing states. These 11 states with low unemployment have a total adult population of about 17 million, or about 7.0 % of the U.S. total.

It's a good point about the low unemployment states can not accept all the millions of unemployed. But this is too aggregate of data to be really useful and does not tell the whole story. The WSJ blog post, City Unemployment: Slow Progress, provides a breakdown of data on metro areas. It noted that rates are as high as 29.3% at El Centro, Calif. to as low as 5.8% at Washington-Arlington-Alexandria. For metro areas with jobless rates above 15%, 8 out of the 10 are in California.

(Click on tables for clearer images.)
The above map is from America's recovery: Where the jobs are | The Economist. While it only provides two ranges of data, it is worth noting the concentrations of red in California, followed by Florida and lastly patchy in the area "across the country's manufacturing belt". The areas doing better are Texas, across the Plains and along the East Coast from Virginia up.


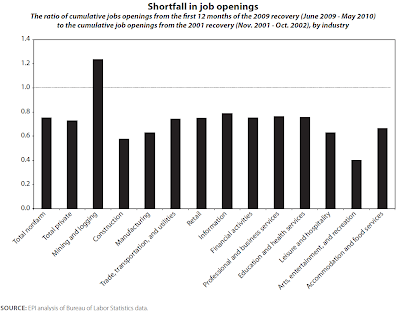
The table above is another way of looking at sector performance. Most of the sectors/industries are well below the recovery of 2002, but we do see that again mining and logging is doing the best overall. I suspect that we would see this same pattern across all resource extraction sectors including farm sectors. The one surprise in the data was that arts, entertainment and recreation did so poorly this time.

The slowdown in construction was expected. But Mishel et al. use that as a point of skepticism about structural unemployment. Their figure is not fine enough data to make any hasty conclusions and they admit that construction labor lost 2 million jobs which "accounts for about 25% of all private-sector jobs lost". They then conclude that many instead of joining the unemployment lines found jobs in other sectors and "some have left the country". In addition to the fact that many went back to their country of origin, some of the workers in construction are considered independent contractors or day laborers and as such may not be entitled to unemployment compensation and thus fall out of the labor pool.

Conclusions:
Even if there was no structural unemployment there could still be structural rigidity in the economy. But even with these sets of data, it appears that the labor markets are rigid in certain ways. Ideally the growth across sectors would be very close to the same results and would converge toward a median range. Also the map and metro area data show the divergence of labor markets. We would expect differences in rates but more convergence than what we are seeing.

The data seems to point out that there may be structural rigidity in the resource extraction sectors like mining and logging. If it is showing up in the labor markets and the ISM reports then it seems safe to say that at least some of that is affecting our economy.

Paul Krugman's Words on the Issues.
Job openings have plunged in every major sector, while the number of workers forced into part-time employment in almost all industries has soared. Unemployment has surged in every major occupational category.
...
So what you need to know is that there is no evidence whatsoever to back these claims. We aren’t suffering from a shortage of needed skills; we’re suffering from a lack of policy resolve. As I said, structural unemployment isn’t a real problem, it’s an excuse — a reason not to act on America’s problems at a time when action is desperately needed.

Not every sector has plunged, unless he means that mining and logging is minor. It was major enough to be included in both reports. As far as "no evidence whatsoever", then even the reports that claim no structural unemployment are providing clues that there is some. Albeit, small compared to the total aggregates, it maybe the bottlenecks that prevent a smooth transition from the present state to the undiscovered country (the future).

I do not find it as an excuse to do nothing but the need for the US to do things that address the microeconomic market failures that prevent full recovery of the job markets. Part of this is designing stimulus plans that are more targeted toward structural rigidity and creating an atmosphere conducive to investments especially long term projects. Something that Krugman has been unwilling to address.


Market Enhancing or Market Destroying Regulations?
Op-Ed Columnist - Structure of Excuses - NYTimes.com

Debunking the theory of structural unemployment

Fair Game: Blaming Older Workers for High Unemployment

Bailouts and Aggregate Demand presents the argument that bailouts are inconsistent with aggregate demand solutions and is more along the lines of aggregate supply solutions.

Spending Money Can Be Difficult for Some Middle-Aged Governments talks about the fact that the US government can not seem to spend fast enough to increase aggregate demand. There are no "shovel ready projects" out there.

Putting Austrian Business-Cycle Theory to the Test - Robert P. Murphy - Mises Daily
First of all, Austrians can easily explain why there is a general drop in employment after a bubble pops, rather than just drops in (say) capital-goods industries. The problem in the aftermath of a bubble isn't merely that a "given" level of demand switches from one sector to another. On the contrary, people in general are poorer than they thought they were at the height of the boom.
Government actions crippled the economy-how?


Structural Problems, Not Structural Unemployment - NYTimes.com

Structural Impediments


Critiques of Krugmann:
It's the Housing, Stupid


Structural Unemployment a Myth?

Show me the Employment Structural Rigidity:
City Unemployment: Uneven - Real Time Economics - WSJ

America's jobless recovery: Demand, supply, and the Fed | The Economist

CARPE DIEM: Online Job Openings Reach 22-Month High in Sept.

The USA falls in Forum Competitiveness Rankings

Political Calculations: How Much Does It Cost to Employ You?

Small Biz Is Still Sucking Wind - The Curious Capitalist - TIME.com

Lessons from South Africa’s Minimum Wage Problem « Modeled Behavior

United States of Wage Gaps - Map of the Gender Gap in Pay by State - NYTimes.com
Census Data Shows Poverty Rates by State in 2009 - NYTimes.com

Dani Rodrik's weblog: Growth reducing structural change

Economic growth: Importing job growth

Energy Leaders Blame Oil and Gas Subsidies for Weak Prospects
http://www.worldwildlife.org/who/media/press/2010/WWFBinaryitem16817.pdf

Less for Success: Builders Roll out New Floor Plans and Projects for the New Market - Design, Marketing - Builder Magazine

The Biotech Advantage Why women start biotech firms at higher rates than they start other kinds of high-tech firms.

Fluidity And Mobility: A Newly Defined Middle Class : NPR
Traditionalists have argued that dynamic, open-market economies are the most dependable institutions for vaulting individuals and households to a coveted level of income security, whether through entrepreneurship, homeownership, steady employment or the financial cushion of a pension or savings account. Now, these staples of social stability appear to be in jeopardy. That doesn't mean the aspirations have gone away, or that these aspirations don't motivate Americans in the workplace or the ballot box. Quite the opposite. The quest for economic opportunity, aspiring to enter the ranks of a new middle class, is in our cultural DNA.


Misc. Interesting Articles:
Hysteresis and Monetary Policy «  Modeled Behavior

Free Market Says, "No Thank You" to Loan Programs - The Entrepreneurial Mind

In Pursuit of Empirical Macroeconomics, Arnold Kling | EconLog | Library of Economics and Liberty

Does the US Economy Need Another Stimulus Package? - Frank Shostak - Mises Daily

Unemployment Rates, an International Apples to Apples Comparison | Angry Bear

The Capital Spectator: THE RISING INFLUENCE OF BETA

The Unbearable Slowness of Understanding - NYTimes.com

3 Share Nobel in Economics for Labor Market Analysis - NYTimes.com
The Beveridge Curve

Models Versus Slogans

The Worst Economist In The World, 10/27/10 - NYTimes.com

Environmental and Urban Economics: Do High Local Electricity Prices Repel Manufacturing Jobs?

Sticky Wages Hold Back Job Growth - Real Time Economics - WSJ

Economist's View: Stop the Unemployed from Becoming Unemployable

Misc. Links/ISM report:
Calculated Risk: Update: Regional Fed Surveys and ISM

The Capital Spectator: ANOTHER DURABLE GOODS REPORT, ANOTHER ENCOUNTER WITH THE NEW NORMAL

Labels:

Tuesday, December 14, 2010

A Macro View: Perusal of Structural Rigidty.

The Macro View of the Markets has been spending a significant portion of its inches on the subject of Structural Rigidity {SR} and this post will be no exception to that pattern. This post will review some of the clues and areas of concern in regards to SR in the US, and then provide some other areas that may be hampering the flexibility of the US economy.

Review of Structural Rigidity Concerns:
From the others posts on SR, let me enumerate and review them here.
1. Some of the first clues looked at was in regards to manufacturing and non-manufacturing sectors of the economy through the ISM reports. The ISM reports were showing a picture of SR with the price index very high and maintaining a level close to 70 for the past several months, a high number of commodities reported in short supply along with most being longer term shortages as the multiple months' commodities grew, and slower supplier deliveries. And sure enough, the PPI was Hotter Than Expected.

2. Minimum wage increases prevent the formation of human capital. This also is a major contributor to the phenomenon of "sticky wages". This short article entitled Sticky Wages Hold Back Job Growth from the WSJ presents some of the reasons. Prices are the signaling device to markets of relative abundance or scarcity of resources. When prices become sticky then the market assumes there is not a shortage of labor and no reason to adjust the factor inputs in the production process. If capital became cheaper then we would see a shift in the inputs of capital and technology and possibly a shift away from as much quantity demanded of labor. The opposite is prevented in labor markets. Adam Ozimek provides some food for thoughts on the "structural labor market problems" at Lessons from South Africa’s Minimum Wage Problem. He makes the point that the people that do not get hired are the real losers if minimum wage is set above the market clearing price, especially for unskilled labor.

3. Mining and logging showed a more robust hiring than the other sectors and showed the least amount of increase for underemployed workers. Various moratoriums or over-restrictive regulations have prevented further developments in resource extraction industries. Of course, the BP oil blowout did not help the situation any also. It is also important when looking at various the components of SR to consider if the factors are converging indicating less SR or are diverging which could signify growing SR in the economy.

4. Regionally by the metro areas show some divergence in rates of unemployment. States also showed this divergence but it was shown that even if it was equalized the low unemployment rates states could not absorb even a significant fraction of the total army of unemployed as well as underemployed.


Other Areas of Probable Structural Rigidity:
This in no way is meant to be a complete list of bottlenecks or components of SR but just a first attempt at identifying some additional components.

1. The current economic slowdown has created a strong trend where men are losing jobs at a higher rate than women. Some have labeled it as "The Mancession" and most recently it was noted The Declining Demand for Men. These issues are related to structural rigidity, but are derived more from social and cultural norms, and practices. As such, these issues will continue with us for a long time no matter how much Warren Farrell wants to Save the males!

2. Natural resource extraction industries are notorious for rent seeking activity globally. The US is no different in that the entire complex rules, regulations, protectionism, taxes and yes subsidies distort the markets in hundreds of ways. This topic is too broad to cover all the areas and levels of these issues here, but an interesting aspect of it is when "Energy Leaders Blame Oil and Gas Subsidies for Weak Prospects". Some of the background information and facts are derived from the paper from "WWF for a living planet" at Fossil Fuel Subsidies. Upon careful reading of the analysis shows that they do identify negative externalities that are not factored into the price of gas and oil products. But they also imply that any reduction of tax rates below the maximum is a subsidy. Clearly it is not strictly a subsidy and often applied on marginally producing wells. Just as Alaska reduces or eliminates tax burdens on marginally producing wells.

3. Government rules and regulations in general prevent the reallocation of resources across sectors and the formation of new capital. John Stossel presents some good examples of these Regulations Overwhelming Small Businesses. Stossel also provides some interesting videos on his blog at Fox Business including an amusing one on how Government Kills Businesses.


4. Not only does governments at all levels stymie the formation of capital and thus creates structural rigidity, it also seems to be impeding the ability of government itself to maintain its investment levels. Mike Mandel shows how the average age of capital stock through the three aggregate broad sectors of residential, non-residential and government changed over the past 40 years at Our Aging Capital Stock.

Hat tip to Paul Krugman, who thinks that the problem has to do with the government "can’t muster the political will" at Build We Won’t. Karl Smith shows that it is not because a lack of funds available at Spending Money Can Be Difficult for Some Middle-Aged Governments. He talks about the fact that the US government can not seem to spend fast enough to increase aggregate demand. There are no "shovel ready projects" out there.

5. The US education system is basically characterized as a monopoly market provided by government and has not fundamentally changed in decades. From my own observations, it has been unresponsive to the new needs of business or even government presently. High school has been more of a holding cage than a place that will create skills and knowledge sets that allow graduates to compete in the global economy. But I am not sure what the answers to these dilemmas are.

Conclusion:
This post listed some of the structural rigidity issues covered so far on the Macro View of the Markets and briefly introduced some other areas for further consideration. Not only does it seem that government at all levels are getting in the way of capital formation and development but is also creating rigidity in its own ability to create public goods. This is a deterioration and degradation of "the commons". Instead of Krugman and his ilk screaming for more spending, he should be shouting about how inefficient government is becoming in providing public goods and services.

Structural rigidity can also be shown by social mobility or lack thereof. I close with some thoughts on the middle class from Samuel R. Staley at Fluidity And Mobility: A Newly Defined Middle Class.
Traditionalists have argued that dynamic, open-market economies are the most dependable institutions for vaulting individuals and households to a coveted level of income security, whether through entrepreneurship, homeownership, steady employment or the financial cushion of a pension or savings account. Now, these staples of social stability appear to be in jeopardy. That doesn't mean the aspirations have gone away, or that these aspirations don't motivate Americans in the workplace or the ballot box. Quite the opposite. The quest for economic opportunity, aspiring to enter the ranks of a new middle class, is in our cultural DNA.


Other links for Structural Rigidity.

Did the Minimum Wage Increase Destroy Jobs?

Census Data Shows Poverty Rates by State in 2009 - NYTimes.com

Economic growth: Importing job growth

Political Calculations: How Much Does It Cost to Employ You?

The USA falls in Forum Competitiveness Rankings


The USA falls in Forum Competitiveness Rankings


Fair Game: Blaming Older Workers for High Unemployment


Bailouts and Aggregate Demand presents the argument that bailouts are inconsistent with aggregate demand solutions and is more along the lines of aggregate supply solutions.

Economist's View: Stop the Unemployed from Becoming Unemployable


Block That Metaphor

Yep, It's Demand - NYTimes.com

Dollar: National Currency With State Implications - Real Time Economics - WSJ

Guest Contribution: 5 Reasons America Needs Korea Free Trade Deal

iPhone Adds $1.9 Billion to US Trade Deficit

Build We Won’t


Men-Women:
What's Going to Happen to Men?

United States of Wage Gaps - Map of the Gender Gap in Pay by State - NYTimes.com

The Biotech Advantage Why women start biotech firms at higher rates than they start other kinds of high-tech firms.

Labels:

Friday, December 10, 2010

Oil Exports and the Falsity of Headline Numbers.

EIA:
"A lie gets halfway around the world before the truth has a chance to get its pants on."
-- Winston Churchill

The problem then becomes that the truth is no longer considered a valid point of view or even open for discussion. The lie is so ingrained as it drowns out any hope that truth will appear. Take for example the myth that the US manufacturing base is collapsing. This lie is dispelled by the CFMMI Data Series from the Federal Reserve Bank of Chicago. Every decade the index (IPMFG) has been higher. That is, the index from the 80s was higher than the 70s, and the 90s was greater than the 80s, and 2000s was higher than the 90s. Even now the index is higher marginally than it was 10 years ago, even with the economic lost decade. This index is not affected by inflation and is growing on average faster than the population also.

The New Memes


That is simply stating the facts {from
Weekly U.S. Exports of Crude Oil and Petroleum Products (Thousand Barrels per Day)}. The problem becomes when this is interpreted to mean that prices in the US are too high because of shipping US finished petroleum products overseas. I could not find the incidence when oil executives were grilled on whether any oil products were shipped overseas during Katrina, but this article explains some of this type of reasoning: Senator Demands Detail on U.S. Oil Exports. First, Ron Wyden is looking for a scapegoat as the information about imports and exports are easily available at the U.S. Energy Information Administration but does not include firm level data.

Secondly, the falsity is that petroleum products exported are of the same quality and basis for the gasoline that goes into our cars. This forms the basis for an argument that goes the US should not drill in ANWR as most will be exported to Asian countries such as Japan. As a stable trading partner and political ally, I find no reason to not export whatever they are willing to pay for. But more importantly, what the US exports to Japan is mostly a by-product of the oil refinery process called petroleum coke. Over the last two years, around 75% of Japan's imports of petroleum products was petcoke. (You can find the information at:
Total Crude Oil and Products Exports by Destination.)

Where are the Exports Going?
Below is a list of countries by export volume with numbers included of average monthly exports in thousands of barrels and percentage increase of volume in the last two years vs. September 2005 to August 2008.

One thing to notice on this list is that a few of them, and most importantly the top two, are actually the top in exporting crude oil to the US in reverse order. Looking further down the list and specifically looking for large percentage increases, it is easy to see that many are small countries close to the US and/or also US suppliers. For example, Columbia, Costa Rica, and Nigeria increased their imports from the US by 346.25%, 349.40%, and 223.63% respectively. I would expect that their demand for processed petroleum products will continue to increase dramatically as they grow each of their respective economies.
What does this mean?
It means: it is best to take any factoid as just a starting point and that delving deeper into the numbers is a better practice. Just like the manufacturing sectors, the oil industry facts are often hidden behind emotions and simplistic explanation models. For example, the oil industry is stated as an oil monopoly when in fact it is better described as an oil oligopoly. Using Yahoo search engine for "oil monopoly" provides nearly 40 million results and for "oil oligopoly" provides a little over 400 thousand results. It seems more writers need to go back to Economics 101. One factoid is how the barrel of crude oil is broken down into its constituent parts as this next passage summarizes.
Crude Oil : A Breakdown of Refined Volumes
The largest share of the 42 gallons of crude oil ends up as a finished motor gasoline. Motor gasoline accounts for 19.65 gallons (~ 47%) of the finished products produced from a barrel of crude oil. Next is distillate fuel or diesel at 10.03 gallons (~ 24%) . A distant third is jet fuel at only 4.07 gallons per barrel (~ 10%) of crude. Residual oil is typically around 1.72 gallons per barrel (~ 4%).

Other petroleum products that are created from a barrel of oil during the refining process include: still gas, petroleum coke, liquified refinery gas, asphalt and various oils for lubricants, kerosene, waxes and other miscellaneous products. These "other" hydrocarbon products account for the final 15% of the barrel or around 6.53 gallons of the 42 gallon barrel.

The article goes on to explain that diesel is also a primary driver of crude oil demand. Thus the one that is in short supply given the market price will be the driver of quantity supplied to the market. This also may help explain why high income countries trade petroleum products across their borders in both directions. In the short list above we saw the US exporting to Netherlands, Singapore, and Japan. Further down the list included countries such as Spain, France, Germany and Greece.

If the US wants to upset our suppliers of crude, or our trading partners, or even small nations in the region then it might be a good idea to restrict exports of petroleum products. But if want the efficiency of the markets to work, then the US needs to encourage more domestic production of refined petroleum products. This a value added product that uses our depth of human capital as well as extensive amounts of capital, while leaving our trading partners opportunities to specialize in what they do best. The breadth and depth of petroleum products, including all the blends of gasoline, makes the US a natural for increased specialization in this export area. Of course, this is a sector that could be called structurally rigid.


Misc. Links:
U.S. Imports & Exports
U.S. Total Crude Oil and Products Imports

BizzyBlog

Weekend Reading – Santa Clause Rally or Grinchy Finish to 2010? | Phil’s Stock World

IS THE ISM NEW ORDERS:INVENTORIES SENDING RECESSION WARNING?

How to Read the Data: ISM Manufacturing Orders vs Inventory

Fake-Out Thursday – Oil Scam Continues Unabated - Phil's Favorites

Labels: , ,

Tuesday, December 07, 2010

RSY XXII: Sabrient's Ratings Review

The RSY portfolio selection and re-balancing is based on Sabrient's ratings of stocks. We also use qualitative factors to help pick which stocks and when to make trades. Thus we need to keep a watchful eye on the change in ratings for the stocks that are in the portfolio especially if Sabrient downgrades a stock to Hold and then more importantly to Sell or StrongSell. Bellow is a summary output of the RSY portfolio using the Stock Ratings Reports product from Sabrient.

This does not include GAIN or NGPC as this was dropped from Sabrient's ratings. GAIN has gone up since we took some partial gains and continues to provide dividends on a monthly basis. NGPC has dropped some, since then, but still represents a substantial gain over the entry price. It also should be providing a dividend by months end. At that time RSY may wish to exit the position if the stock charts still look negative.

FL, LZ and MRH are rated as StrongBuys and thus will maintain their recommended positions in the portfolio. If EGAS drops to a hold then RSY may consider reducing the size of holdings, but until then it will maintain its current recommendations. IVR is another that should be providing a substantial dividend by end of the month. RSY recommended a trade that netted $386 on the 200 shares sold, and is sitting on nearly 600 in gains currently. Thus, until the next ex-dividend date comes, RSY recommends a hold of the remaining shares.

Sabrient is screaming to sell the TSH position, but with a declared ex-dividend date of December 15th, RSY also recommends a hold at least until the 16th. Even given that RSY provided no recommended sells yet, an individual investor must weigh all the facts to determine his/her own investment decisions.

Labels: ,

Monday, December 06, 2010

A Macro View: ISM Reports November, A New Normalcy?

Normalcy is the best way to describe the ISM reports for November. The indexes show a steady growth for both the manufacturing and non-manufacturing sectors. Econoday states it as following for both sectors.
ISM Non-Mfg Index:
This report falls in line with the run of other data, this morning's employment report excluded, that are pointing to moderate, steady economic growth ahead. {1}

ISM Mfg Index:
This report points to a rebound for factory data which proved soft in last week's durable goods report. {2}

While there are still concerns about price increases for inputs, shortages of commodities and delays in supplier deliveries, overall the report fell into acceptable and predictable ranges. Econoday reports that the consensus estimate for headline index was right on the money for the non-manufacturing index at 55.% {range 54 to 58%} and for the manufacturing index it missed the consensus by .4% with the actual being 56.6 {range 55.5 to 57.2%}.

Manufacturing Concerns Going Forward. {3}
Both reports are marked by very few drastic changes in the indexes and most being on the positive side of the 50 mark, which indicates growth in the sectors. Manufacturing showed the most changes with production dropping 7.7% to 55% and supplier deliveries jumping 6% to 57.2%. Both negative indicators going forward. The production is still in very positive territory with 55%, but the problem is that this seems to be a fragile indicator going forward. This last month has shown that less respondents said production was increasing and more respondents said production was decreasing resulting in a net drop of gainers over losers of 17% to just 6% over last month. Also six industries reported growth but even more at 7 industries reported decreases in production. It looks like growth is narrowing in a range of sectors while slowdowns are broadening.

The slowing of supplier deliveries portends structural rigidity in the economy. Not much has changed in regards to input commodities as 8 commodities were multiple months on the list out of the 16 listed for manufacturing and commodities of short supply added two new ones. Similar results are also noted in the non-manufacturing report with 7 commodities of multiple months out of the 16 listed.

Non-Manufacturing Concerns Going Forward. {4}
Most of the indexes maintained a positive stance with only marginal differences from last month. Just as manufacturing, the business activity/production was off by 1.4% but still stayed at an acceptable level of 57%. The one index that made a move crossing the 50 mark on either report was inventories as it increased 4% to 51.5%. This could be a negative indicator going forward, but the reports do not indicate whether this is planned increases in inventory or unplanned. From at least one of the respondents, it seems to indicate a change to positive expectation and as such it could be a positive sign. The respondent stated: "Expect higher sales in November and December" and "Increased business activity."

Summary of Positive Signs.
The headline non-manufacturing index (NMI) is on an upward trend since August 2010 lows of 51.5 to last month of 55%. It has been even higher multiple times than last months showing this year but did maintain above the average for the last 12 months of 53.5%. Price indexes decreased for both sectors, dropping 5.1 to 63.2 for non-manufacturing and 1.5 to 69.5% for manufacturing. Although a significant drop in non-manufacturing, they both are very high in the 60s. Manufacturing employment index adjusted marginally down and maintained an acceptable level at 57.5%, but non-manufacturing may have broken out of its stagnating neutral stance since around February of this year. The employment index jumped 1.8 to 52.7% for a increasing trend since August this year with a low of 48.2%. Below is a chart of the non-manufacturing index from February of this year with a linear trend line drawn. (Click on table for clearer image.)

The trend line is just ever so slightly up from a flat line and most of that is due to the last three months being above the 50 mark. The economy needs this trend to continue if it is to significantly reduce unemployment.

New export orders for non-manufacturing jumped 4 to a very respectable 59.5, which surpasses the manufacturing index that dropped 3.5 to 57%. Both very acceptable levels which fueled some positive comments from respondents. Some of the positive comments are quoted below:
Manufacturing ISM Report
"Business continues to improve; however, rising material prices are eroding margin. Increases to the consumer are inevitable in early Q1 2011." (Paper Products)
"International markets expanding rapidly. Domestic market is slowly rebounding." (Transportation Equipment)
"Capital projects are being released, which is improving our sales." (Computer & Electronic Products)

Non-Manufacturing ISM Report
"Business remains steady; outlook for fourth quarter is good." (Information)
"Trending favorable — see more activity toward additional staff and capital expenditures for 2011." (Finance & Insurance)
"Business is stable. Customers are exerting a lot of pressure to lower prices." (Agriculture, Forestry, Fishing & Hunting)

The New Normal?
The ISM reports are signaling an economic recovery with steady growth. Hopefully this translates into the correlation that Norbert J. Ore stated in the manufacturing report.
Ore stated, "The past relationship between the PMI and the overall economy indicates that the average PMI for January through November (57.3 percent) corresponds to a 5.1 percent increase in real gross domestic product (GDP). In addition, if the PMI for November (56.6 percent) is annualized, it corresponds to a 4.9 percent increase in real GDP annually."

Obama fears that we may be into a "new normal" with high unemployment rates but contrasted with high levels of profits for businesses. {5} This could signify that the US is facing structural rigidity as businesses are not adapting and investing since expectations have not drastically changed. While more tax breaks to businesses might be helpful, it has more to do with signaling to the markets positive signs. Like delaying what the tax rates will be next year, that certainly is not a way to inspire confidence in the markets.


Links:
1. Econoday Report: ISM Non-Mfg Index December 3, 2010

2. Econoday Report: ISM Mfg Index December 1, 2010

3. ISM - Media Release: November 2010 Manufacturing ISM Report On Business®

4. ISM - Media Release: November 2010 Non-Manufacturing ISM Report On Business®

5. Obama Fears `New Normal' Economic Recovery of High Profits, No Job Growth

5a. Obama Warns of ‘New Normal’ for Economy

Supply Excellence — How to Read the Data: ISM Manufacturing Orders vs Inventory

Misc. Links:
Economists React: ‘Painful Reality Check’ on Jobs - Real Time Economics - WSJ

A Wall Street Journal Column Understates the Size of U.S. Manufacturing | Cato @ Liberty

Management: How the enterprises trashed the economy | The Economist

Mish's Global Economic Trend Analysis: SpendingPulse: Retail Sales Led by Apparel, Consumer Electronics and Appliances Down

Calculated Risk: Hotels: RevPAR up 10.1% compared to same week in 2009

Calculated Risk: Catching Up: ISM Non-Manufacturing index showed expansion in November

Is the ISM 'New Orders to Inventories' Ratio Sending Recession Warning? - Seeking Alpha


Unemployment Issues:
Mish's Global Economic Trend Analysis: After All the Hype, Jobs Up an Anemic 39,000; Unemployment Rises to 9.8%; Quicksand of Stimulus
Manufacturing payrolls dropped by 13,000 in November, the most in three months. Economists had projected an increase of 5,000.


Does One Month Make a Trend? - NYTimes.com

Calculated Risk: Employment Summary and Part Time Workers, Unemployed over 26 Weeks

Why Didn’t Retailers Hire?

CARPE DIEM: Bright Spots: Temp Help and Mfg. Overtime Hours; But Jobless Recovery May Continue to 2012

America's jobless recovery: Where are the jobs? | The Economist

The urgency of bringing down unemployment

Economist's View: Stop the Unemployed from Becoming Unemployable

Employment %
Higher %
Same %
Lower
Index
Nov 2010 16 73 11 52.7
Oct 2010 13 69 18 50.9
Sep 2010 15 68 17 50.2
Aug 2010 13 69 18 48.2
Jul-10 17 73 10 50.9
Jun-10 18 70 12 49.7
May-10 22 65 13 50.4
Apr-10 22 61 17 49.5
Mar-10 16 65 19 49.8
Feb-10 12 68 20 48.6
Jan-10 10 62 28 44.6
Dec-09 9 70 21 43.6

Labels: ,

Thursday, December 02, 2010

RSY XXI: Buy 400 FL at $19.29; Portfolio Update.

Foot Locker Inc. (FL) is rated a StrongBuy by Sabrient for its "top momentum score {92}, along with a solid growth profile {67.6}". It also boasts an outstanding Timeliness Score of 97 and a good Earnings Score of 81.7 which measures "overall earnings performance and projected outlook". The forensic accounting score is good overall and nothing negative about the insider buying or selling. Going forward, earnings estimates are expected to steadily increase over the next 4 years along with top line revenues. Cash flow per share is expected to be soft next year but certainly enough to pay out the steady flow of dividends. The dividend yield is a little over 3% which is acceptable for the RSY portfolio, and the next ex-dividend date has been announced for January 12, 2011. For diversification of the portfolio, picking FL also gets RSY into the retail industry. RSY recommends a buy order of 400 shares at a limit price of $19.29 which is close to the daily high and was the closing price. As long as there are no gap-ups at the opening, then we should be fine at this price point.

Update of Portfolio:
RSY is recording a dividend of $8.00 on December 1st from GAIN for the 200 shares held in the model portfolio. Below is a summation of trades along with the gains (or losses) of the model portfolio. (Click on tables for clearer images.)


The next table shows the current recommended holdings in the RSY model portfolio.


Top 15 Stocks Hitting New Highs, But Being Sold by the Smart Money,by: Kapitall,MRH

Labels: ,