A Macro View: ISM August, Trendline Friend or Foe
While the markets had bigger worries than the little ISM reports, both headline numbers of the reports were above consensus expectations. The PMI for manufacturing was three tenths lower than last months number at 50.6% but well above the consensus of 48.5 which was expecting a drop of almost 2 1/2 points. The NMI for non-manufacturing was nicely up .6 to 53.3% which the consensus was expecting a drop of 1.7 to 51%. Both were neatly in the consensus range provided by Econoday with the PMI range of 47 to 51.9% and the NMI range of 49.7 to 56.6%. Looking at the ranges of the consensus, the NMI range as usual is broader. This may reflect that the economists find it harder predicting the non-manufacturing sectors. I do question the one or more economists that thought the NMI would jump nearly 4 points last month.
Overall, the headline numbers were better than expected, but that was based on gloomy forecasts overall. The US was definitely not alone in the manufacturing sectors contracting as noted by World-Wide Factory Activity showed only four countries having higher index numbers in August and 18 countries having negative change month over month.
Trends Are Our Friends ... Or Not
Employment is one of the sub-indexes that the Macro View of the Markets looks at for trends. These are important issues when considering that this weak recovery could be called a "jobless recovery". The graph below is from the Federal Reserve (FRED - Economic Data) which shows two trends. The first starts at February 2009 and peaks at February 2011 with a strong upward trend. The second trend is a downward trend since this February. Whether the second downward pressure persists is the question, and a drop of the latest 1.7 points to 51.8% is a negative indicator for continuing employment growth in manufacturing.

The chart below shows the non-manufacturing employment index with a trend line since December 2009. The slope of the trend line has been declining since at least March 2011. Even before the trend line drops to zero, there is likely to be the start of a downward trend. That is the question we are facing now with the last two months dropping below trend. If the short term trend continues this would mean contraction in the non-manufacturing sectors and the prospect of decent job growth along with it.

The following two graphs shows the number of commodities with multi-month price rises and then total number of commodities rising in price for both manufacturing and non-manufacturing sectors respectively. All four series peaked in April or May of this year creating an upward trend since October 2010 and then a general downward trend since its peak. No trend can continue past the zero-bound limit as in this case. It is important to look at trends since the index numbers are not completely independent events. One month's numbers are likely to follow closely to the last months numbers plus a possible trend factor. The factors and forces causing the respondents attitudes and thus responses in the ISM reports are likely to carry over from one month to another. Even the business cycle theory would have to consider a stochastic process for determining the next stage in the cycle.


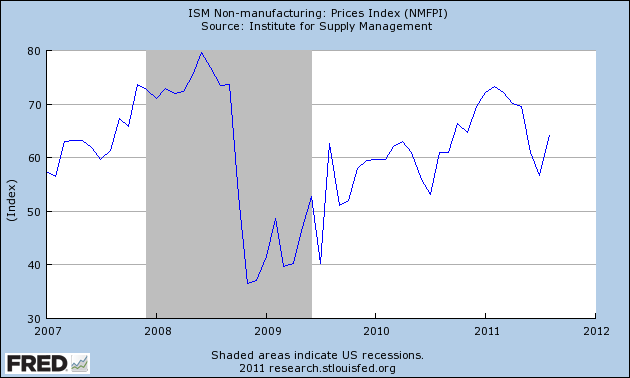
The following two graphs, from Fred Economic Data, shows a recent downward trend for manufacturing with the index dropping 3.5 points to 55.5%. But non-manufacturing has reversed its recent down trend and jumped up 7.6 points to 64.2%. Not that it is a perfect correlation, but input prices have shown a positive correlation with the growth of industries. Take this month, the NMI increased and so did the price index for non-manufacturing, while the PMI declined along with the price index in manufacturing.


That correlation was only based on one month observations but I think it is more broadly applicable than that. That as the economy heats up for the US and thus worldwide expansion also then commodity prices start rising dramatically. This then leads to the economy cooling as a result of higher commodity prices. The weak economy then drives down demand for commodities and then the cycle begins again. Another way of describing this phenomenon is at Our Oil-Constrained Future.
Conclusion and Trends
Overall the ISM reports were better than expected, but fall short of dispelling rumors of a second dip recession. Hopefully, the constraints on economic growth caused by slingshot effects of growth and commodity prices will be solved someday. Maybe by increased production in Libya or Iraq. But these constraints will likely persist until the structural rigidity problems of the US are solved.
This post talked about trends in general terms and avoided too much statistical jargon, and we could have explored more about knowing when a trend has structurally changed or was it just slight deviance from the norm or just an anomaly in the data set. These general discussions should be enough to understand that the graph below does not show a trend line but simply the average over the extreme long term data points.

The first reaction from a technical perspective is that the scale should be log at least on the vertical axis. At the least the numbers should have been adjusted by something like the GDP deflator that adjusts for the value of the dollar over time, especially over long periods of time. Even with these adjustments it might not help since the underlying data appears to be nominal stock prices and not total market cap. That is, what is measured is not value but the arbitrary amounts of money traded for a share. A company can control outstanding shares and thus the price of their share through dilution or stock splits or even reverse stock splits. Lastly, a trend line should go through as many points as possible and be close to the data points. This "trend line" only has one point in common with the data set, and the origin point is immaterial.
And I Will Say It Again....: Why David Trainer is an Idiot
MarketWatch:
ISM Man: 49---48.5%
Non-Man: 51.2%
ISM Manufacturing Comes In Better Than Expected, But Still Weak - Seeking Alpha
The Capital Spectator: A Bit Of Good News For The Services Sector
Good News on ISM « Modeled Behavior
Mish's Global Economic Trend Analysis: Manufacturing ISM Dips Slightly, Barely Above Contraction, Saved by Inventory Growth, Much Weaker than it Looks
The Capital Spectator: Manufacturing Growth Weakens In August
ISM Manufacturing Comes In Better Than Expected, But Still Weak - Seeking Alpha
Calculated Risk: ISM Non-Manufacturing Index indicates expansion in August
Economists React: U.K. ‘Bright Spot’ Dims - Real Time Economics - WSJ
Calculated Risk: Texas Manufacturing Activity "Flat" in August
Misc. Links:
CARPE DIEM: More On 3-Year Inflation Being Lowest in 54 Years
Calculated Risk: ISM Manufacturing index declines slightly to 50.6
CARPE DIEM: Real Consumer Spending Up in July to Record High
August Sales: How Retailers Fared - Real Time Economics - WSJ
Calculated Risk: Pending Home Sales decreased in July
The Sabrient Blog » The Fed’s Bazooka: Revealed As Final Policy Firepower in Jackson Hole
Macro and Other Market Musings: Does Higher Expected Inflation Really Spur Spending?
Stephen Williamson: New Monetarist Economics: Has Politics Paralyzed the Fed?
Mish's Global Economic Trend Analysis: Bernanke's Invisible Bazooka Ploy
The Capital Spectator: Jobless Claims Fell Last Week, But So What?
Econbrowser: The CPI, and Some Key Components
Calculated Risk: Weekly Initial Unemployment Claims decline to 409,000
Calculated Risk: Employment Situation Preview: Another Weak Report
Calculated Risk: Construction Spending declined in July
Are There Too Many Homes in America, Ctd « Modeled Behavior
Macro and Other Market Musings: The Fed Gets Schooled Again on Central Banking: the Swiss National Bank Edition
Political Calculations: A Slightly Better Than Zero Jobs Report
The breaking windows fallacy — Marginal Revolution
Overall, the headline numbers were better than expected, but that was based on gloomy forecasts overall. The US was definitely not alone in the manufacturing sectors contracting as noted by World-Wide Factory Activity showed only four countries having higher index numbers in August and 18 countries having negative change month over month.
Trends Are Our Friends ... Or Not
Employment is one of the sub-indexes that the Macro View of the Markets looks at for trends. These are important issues when considering that this weak recovery could be called a "jobless recovery". The graph below is from the Federal Reserve (FRED - Economic Data) which shows two trends. The first starts at February 2009 and peaks at February 2011 with a strong upward trend. The second trend is a downward trend since this February. Whether the second downward pressure persists is the question, and a drop of the latest 1.7 points to 51.8% is a negative indicator for continuing employment growth in manufacturing.

The chart below shows the non-manufacturing employment index with a trend line since December 2009. The slope of the trend line has been declining since at least March 2011. Even before the trend line drops to zero, there is likely to be the start of a downward trend. That is the question we are facing now with the last two months dropping below trend. If the short term trend continues this would mean contraction in the non-manufacturing sectors and the prospect of decent job growth along with it.

The following two graphs shows the number of commodities with multi-month price rises and then total number of commodities rising in price for both manufacturing and non-manufacturing sectors respectively. All four series peaked in April or May of this year creating an upward trend since October 2010 and then a general downward trend since its peak. No trend can continue past the zero-bound limit as in this case. It is important to look at trends since the index numbers are not completely independent events. One month's numbers are likely to follow closely to the last months numbers plus a possible trend factor. The factors and forces causing the respondents attitudes and thus responses in the ISM reports are likely to carry over from one month to another. Even the business cycle theory would have to consider a stochastic process for determining the next stage in the cycle.


The following two graphs, from Fred Economic Data, shows a recent downward trend for manufacturing with the index dropping 3.5 points to 55.5%. But non-manufacturing has reversed its recent down trend and jumped up 7.6 points to 64.2%. Not that it is a perfect correlation, but input prices have shown a positive correlation with the growth of industries. Take this month, the NMI increased and so did the price index for non-manufacturing, while the PMI declined along with the price index in manufacturing.

That correlation was only based on one month observations but I think it is more broadly applicable than that. That as the economy heats up for the US and thus worldwide expansion also then commodity prices start rising dramatically. This then leads to the economy cooling as a result of higher commodity prices. The weak economy then drives down demand for commodities and then the cycle begins again. Another way of describing this phenomenon is at Our Oil-Constrained Future.
If this model is accurate—and if the ceiling on global oil production really is around 90 mbd and can be expanded only slowly—it means that every time the global economy starts to reach even moderate growth rates, demand for oil will quickly bump up against supply constraints, prices will spike, and we'll be thrown back into recession. Rinse and repeat.
Conclusion and Trends
Overall the ISM reports were better than expected, but fall short of dispelling rumors of a second dip recession. Hopefully, the constraints on economic growth caused by slingshot effects of growth and commodity prices will be solved someday. Maybe by increased production in Libya or Iraq. But these constraints will likely persist until the structural rigidity problems of the US are solved.
This post talked about trends in general terms and avoided too much statistical jargon, and we could have explored more about knowing when a trend has structurally changed or was it just slight deviance from the norm or just an anomaly in the data set. These general discussions should be enough to understand that the graph below does not show a trend line but simply the average over the extreme long term data points.

The first reaction from a technical perspective is that the scale should be log at least on the vertical axis. At the least the numbers should have been adjusted by something like the GDP deflator that adjusts for the value of the dollar over time, especially over long periods of time. Even with these adjustments it might not help since the underlying data appears to be nominal stock prices and not total market cap. That is, what is measured is not value but the arbitrary amounts of money traded for a share. A company can control outstanding shares and thus the price of their share through dilution or stock splits or even reverse stock splits. Lastly, a trend line should go through as many points as possible and be close to the data points. This "trend line" only has one point in common with the data set, and the origin point is immaterial.
And I Will Say It Again....: Why David Trainer is an Idiot
MarketWatch:
ISM Man: 49---48.5%
Non-Man: 51.2%
ISM Manufacturing Comes In Better Than Expected, But Still Weak - Seeking Alpha
The Capital Spectator: A Bit Of Good News For The Services Sector
Good News on ISM « Modeled Behavior
Mish's Global Economic Trend Analysis: Manufacturing ISM Dips Slightly, Barely Above Contraction, Saved by Inventory Growth, Much Weaker than it Looks
The Capital Spectator: Manufacturing Growth Weakens In August
ISM Manufacturing Comes In Better Than Expected, But Still Weak - Seeking Alpha
Calculated Risk: ISM Non-Manufacturing Index indicates expansion in August
Economists React: U.K. ‘Bright Spot’ Dims - Real Time Economics - WSJ
Calculated Risk: Texas Manufacturing Activity "Flat" in August
Misc. Links:
CARPE DIEM: More On 3-Year Inflation Being Lowest in 54 Years
Calculated Risk: ISM Manufacturing index declines slightly to 50.6
CARPE DIEM: Real Consumer Spending Up in July to Record High
August Sales: How Retailers Fared - Real Time Economics - WSJ
Calculated Risk: Pending Home Sales decreased in July
The Sabrient Blog » The Fed’s Bazooka: Revealed As Final Policy Firepower in Jackson Hole
Macro and Other Market Musings: Does Higher Expected Inflation Really Spur Spending?
Stephen Williamson: New Monetarist Economics: Has Politics Paralyzed the Fed?
Mish's Global Economic Trend Analysis: Bernanke's Invisible Bazooka Ploy
The Capital Spectator: Jobless Claims Fell Last Week, But So What?
Econbrowser: The CPI, and Some Key Components
Calculated Risk: Weekly Initial Unemployment Claims decline to 409,000
Calculated Risk: Employment Situation Preview: Another Weak Report
Calculated Risk: Construction Spending declined in July
Are There Too Many Homes in America, Ctd « Modeled Behavior
Macro and Other Market Musings: The Fed Gets Schooled Again on Central Banking: the Swiss National Bank Edition
Political Calculations: A Slightly Better Than Zero Jobs Report
The breaking windows fallacy — Marginal Revolution
Labels: ISM, Macro-Economics
posted by Ronald Rutherford at 10:45 AM
![]()
![]()


0 Comments:
Post a Comment
<< Home