Sunday, March 18, 2012

ISM Non-manufacturing stock picks...

My last post presented 22 Stocks That Perform Well When The ISM Index Goes Up along with some analysis of the ISM reports published in March. The picks were based on the manufacturing index along with 5 of the subindexes (employment, new export orders, new orders, and price). The following list of stocks are based on the most recent ISM report on the non-manufacturing sectors of the economy and the same subindexes. Since the composite/headline index was only added in early 2008, the subindexes were useful in allowing a backtest since early 2000.

As expected the stock picks this time should overlap with the last report as both the non-manufacturing and especially the manufacturing indexes are highly correlated with the overall growth of the economy. Even the backtested annualized returns were the same and above the S&P 1500 flat weighted. At this time, it might also be interesting to see the sector breakdown of the last regression. The sector limit was raised to 30 and some sectors still reached that limit.
Consumer Discretionary 30
Consumer Staples 21
Energy 22
Financials 30
Health Care 16
Industrials 30
Information Technology 3
Materials 25
Telecommunication Services 1
Utilities 26
The table above was just for the last rebalance date but over time there are some observations to notice. The ones that are at 30 (Consumer Discretionary, Financials and Industrials) stayed at the limit the whole time. Those not reaching the limit stayed under the limit and the low ones stayed low. So overall consistent across sectors over the rebalance periods. The two sectors that had the most variance across rebalance dates were Energy and Health Care. While both suffered the most during the spring and summer of 2008, Health Care took it on the chin in the spring of 2000 during the dot-com bust. Below are the picks based on the regression analysis of the non-manufacturing ISM index:
American International Group, Inc. (AIG)
Goodyear Tire & Rubber Company (GT)
The Hartford Financial Services Group, Inc. (HIG)
Principal Financial Group, Inc. (PFG)
Discover Financial Services (DFS)
Prudential Financial, Inc. (PRU)
Wynn Resorts, Limited (WYNN)
MetLife, Inc. (MET)
SunTrust Banks, Inc. (STI)
Coventry Health Care, Inc. (CVH)
Regions Financial Corporation (RF)
Cliffs Natural Resources Inc. (CLF)
Tyson Foods, Inc. (TSN)
Cummins Inc. (CMI)
Mattel, Inc. (MAT)
Marathon Oil Corporation (MRO)
EOG Resources, Inc. (EOG)
Macy's, Inc. (M)
WellPoint, Inc. (WLP)
Devon Energy Corporation (DVN)
Newfield Exploration Company (NFX)

Disclosure:
I have no positions in any stocks mentioned, and no plans to initiate any positions within the next 72 hours.

Disclaimer: This article is published solely for informational purposes and is not to be construed as advice or a recommendation to specific individuals. Individuals should take into account their personal financial circumstances in acting on any rankings or stock selections provided by Sabrient. Sabrient makes no representations that the techniques used in its rankings or selections will result in or guarantee profits in trading. Trading involves risk, including possible loss of principal and other losses, and past performance is no indication of future results.

Labels: ,

Tuesday, February 14, 2012

ISM Reports January 2012, With Heteroskedasticity

The recent jobs reports was such good news for the economy and the markets that it overshadowed the good news contained in the ISM reports. My latest ISM article on the ISM reports was lukewarm at best, but this month has more silver linings. The biggest upside surprises occurred in the non-manufacturing index where the headline index jumped up 3.8 to 56.8% beating the consensus of 53.3-53.5% and the consensus range of 52-54%. This was even after revisions in December upward of 0.4%. The manufacturing headline also bumped up one percent to 54.1% but after a revision down last month of 0.8%. Econoday succinctly stated a summary of the market reactions to the report.
The manufacturing sector is a bulwark of the economy and, despite troubles in Europe and slowing in Asia, continues to expand, underscored by a faster rate of expansion for new export orders which rose 2 points to 55.0. Despite the strength in orders, there's little initial reaction to today's report.


The chart above comes from the WSJ at World-Wide Factory Activity. From that sample of countries, it shows that the US is leading the world in economic development. We may be the first to recover from the great recession while other countries are facing their own set of economic problems.

Prices and Employment
Price pressures have receded in recent months but there are concerns about prices going forward. Prior experiences in this economic cycle has shown that every time segments of the economy start heating up, that this is followed by pricing pressures in those sectors. Manufacturing price index jumped 8 points to 55.5%. Slow price increases is a positive sign but this trend in the price index started in October 2011 when the index dropped to 41%. But commodity for manufacturing show no signs of causing problems in the near future. Commodity prices in non-manufacturing also showed no signs of increasing for the near future, but price index increased 1.5 to 63.5% indicating price and cost pressures going forward. On a sector wide basis this pricing pressure is wide as 13 sectors reported increases in prices and only 3 reporting decreases with 31% reporting higher prices and only 5% reporting lower prices.

During the "Great Recession" the manufacturing sectors have led the employment index. But unfortunately most job creation strength is in the "services" sectors. But that situation may have changed last month. The chart above shows the dramatic increase in the non-manufacturing index last month and the trends in the index since December 2009. A few months ago I lamented that the upward trend line had decayed but hopefully this recent report is a portent to future strength in the non-manufacturing sectors. Obama should be pleased. Even if this jump is a fluke, reversion to the mean will continue to indicate employment strength in the mid-50s range.

It is also worth noting that the new export orders increased for both indexes to acceptable mid-50s range with manufacturing increasing 2 to 55% and non-manufacturing increasing 5.5 to 56.5%. New orders index also showed continued strength with manufacturing increasing 2.8 to 57.6% and non-manufacturing increasing 3.6 to 59.5%. Both indexes and especially new orders is a portent to positive future reports.

Heteroscedas?? what? (Wonkish-stock picks below.)
Last month I introduced a simple regression model based on the ISM manufacturing index changes. This month's regression results will be based on changing the model in two important ways.

The first is to try to correct for any presence of heteroscedasticity in the model runs. Technically that is too much variance in the error terms and thus the model does not reflect minimum variance. Or another way of looking at is that expecting values become unstable. If you were expecting returns of 5-6% but next year the expected returns changes to 1-11%. While the results might not be biased they become less reliable for predicting the future from the sample even if the sample size is very large. The problem may not be as significant in time series data like stock returns and manufacturing indexes, but the reduction of heteroscedasticity should increase the reliability of the model over the long term.

The model now checks for heteroscedasticity and then tries to correct on the runs that we reject the test for no heteroscedasticity. Preliminary runs resulted in slightly improved performance for the Lovers group.

The second tweak to the model was incorporating a factor into the model that indicates the level of the headline index. It is not so much the change in direction of the index (i.e. going up or down) as the last model did, but also whether the index is above or below the 50% mark. This is the dividing line between expansion or slowing of the sector (manufacturing) of the economy and also correlated with the overall growth of the economy.

Last month our picks resulted in 100% winners on the "Lovers" side as expected if the ISM reports continued to be positive. Considering that the broader market {S&P up over 4%} also increased during that time, it was not unexpected. This also drove most of the "Haters" to positive returns but below Lovers. Below is a summary of the returns.
Lovers:
(SCSC) ScanSource, Inc 9.2%
(VCI) Valassis Communications, Inc. 21.4 %
(RHT) Red Hat, Inc. 13.75%
(GPOR) Gulfport Energy Corporation 13.25 %
(GCI) Gannett Co., Inc. 1.25%
(LAD) Lithia Motors, Inc. 16.8%
(LNC) Lincoln National Corporation 10%
(SNX) SYNNEX Corporation 9.4%
(HIG) Hartford Financial Services Group, Inc. 8.25%
(AGCO) AGCO Corporation 5.7%
(PRU) Prudential Financial, Inc 10.2%
Haters:
(HCP) HCP, Inc. 1.5%
(LLTC) Linear Technology Corporation 11.6%
(VRSN) VeriSign, Inc. 4.1%
(CTXS) Citrix Systems, Inc. 5.7%
(SHAW) Shaw Group Inc. 5.8%
(T) AT&T Inc. -0.15%
New Picks based on ISM manufacturing index:
Lovers:
LITHIA MTRS INC CL A (LAD)
LINCOLN NATL CORP IND COM (LNC)
GROUP 1 AUTOMOTIVE INC COM (GPI)
STANDARD MTR PRODS INC COM (SMP)
FORD MTR CO (F)
HARTFORD FINL SVCS GROUP INC COM (HIG)
UNUM GROUP COM (UNM)
ALLEGHENY TECHNOLOGIES INC COM (ATI)
SCANSOURCE INC COM (SCSC)
AFLAC INC COM (AFL)
WEBSTER FINL CORP CONN COM (WBS)
STANCORP FINL GROUP INC COM (SFG)
Haters:
JUNIPER NETWORKS INC COM (JNPR)
MICROSTRATEGY INC CL A(MSTR)
METROPCS COMMUNICATIONS INC COM (PCS)
The Lovers and Haters lists are in no particular order but only contain Sabrient rated Strong Buys for the Lovers and Strong Sells for the Haters.

Disclosure: I have no positions in any stocks mentioned, and no plans to initiate any positions within the next 72 hours.

Disclaimer: This article is published solely for informational purposes and is not to be construed as advice or a recommendation to specific individuals. Individuals should take into account their personal financial circumstances in acting on any rankings or stock selections provided by Sabrient. Sabrient makes no representations that the techniques used in its rankings or selections will result in or guarantee profits in trading. Trading involves risk, including possible loss of principal and other losses, and past performance is no indication of future results.


Forecast Friday Topic: Heteroscedasticity « Insight Central


MarketWatch Forecast:
ISM Manufacturing: 54.5%
Non-Manufacturing: 53.5%


Misc. Links:

Calculated Risk: ISM Manufacturing index indicates faster expansion in January


The Capital Spectator: Continued Improvement For Manufacturing Activity In January

Vital Signs: Strength in U.S. Manufacturing - Real Time Economics - WSJ

Strong Factory Hiring? Don’t Bet On It - Real Time Economics - WSJ

Calculated Risk: CoreLogic: House Price Index declined 1.4% in December to new post-bubble low

Calculated Risk: Weekly Initial Unemployment Claims decline to 367,000

Econbrowser: Net Exports, Exports, Real Exchange Rates and Manufacturing

The real unemployment rate? — Marginal Revolution

Broader Unemployment Rates, by State - Real Time Economics - WSJ

Calculated Risk: U.S. Light Vehicle Sales at 14.18 million annual rate in January

January Downshift Shouldn’t Be Surprise - Real Time Economics - WSJ

Bring down the rent to boost fairness - The Washington Post

David Smith's EconomicsUK.com: A good start for manufacturing

Vital Signs: Consumer Confidence Inches Down - Real Time Economics - WSJ

The Capital Spectator: ADP: Job Growth Slows In January

The Capital Spectator: Major Asset Classes | Jan 31, 2012 | Performance Update

Jobs:
Human Capital — Marginal Revolution

Vital Signs: Falling Jobless Claims Decline - Real Time Economics - WSJ

Did Economy Really Create 500,000 Jobs? - Real Time Economics - WSJ

Economists React: Jobs Report ‘Positive in Every Way’ - Real Time Economics - WSJ

Good News: Unemployment Falls to 8.3% as U.S. Adds 243,000 Jobs | Business | TIME.com

CARPE DIEM: Highlights from Today's Employment Report

CARPE DIEM: Highlights from Today's Employment Report

The Capital Spectator: Private Payrolls Post A Surprisingly Strong Gain In January

Good News All Around In January Jobs Report

Fantastic news on jobs | Felix Salmon

Calculated Risk: January Employment Report: 243,000 Jobs, 8.3% Unemployment Rate

Economists React: Jobs Report ‘Positive in Every Way’ - Real Time Economics - WSJ

Labels: ,

Wednesday, January 11, 2012

A Macro View: ISM November/December, Haters and Lovers

The MacroView has discussed the Institute for Supply Management (ISM) reports and explored the relationships between the reports and the general health of the economy over the last two years. After first exploring the December reports, this post will explore a new area of research along with some stock suggestions related with the ISM research.

Good but is that Good Enough?
Both headline indexes increased month over month for December reports although non-manufacturing did not make up the ground it lost in November. The non-manufacturing increased .6 to 52.6% in December from a loss of .9 in November. The manufacturing index continued its rise of 1.2 to 53.9% in December after the gain of 1.9% which was on the high side of the consensus range of 52.5 to 54 with consensus point of 53.2%. The non-maufacturing was below the consensus of 53.4 but with-in the consensus range of 52 to 57.5%.

Although the economy is still apprehensive about the European debt crisis, there has been some recent good news on jobs and the unemployment rate with ADP reporting strong job growth in December and the unemployment rate dropping to 8.6%. The employment index in manufacturing continues to be the stronger of the two indexes and last month showed a strong increase of 3.3 to 55.1%, but non-manufacturing continued to be sub-50 at 49.4 even with an increase of 0.5% last month. Respondent comments are also not very encouraging on the jobs front.
Comments from respondents include: "Retirees not being replaced" and "Still in holding pattern; positions are available, but are not being filled."

Respondents' comments are mixed and vary by industry and company. Economic growth continues to be slowed by the lag in employment."

"Continued conservative hiring, with tight discretionary spending controls due to slower growth expectations for 2012, driven by Euro zone sovereign debt concerns and lack of viable U.S. legislative process through the 2012 election." (Computer & Electronic Products)

This just shows that there is still economic uncertainty and the European situation along with a divided government has not helped to increase positive expectations. A hindrance with economic growth has shown signs of finally fading away for the moment, that is prices. The converging direction of the price indexes is good on both sides. After the dramatic drop in the manufacturing price in index in October 2011 by 15 points, last month continued its upward trend with an increase of 2.5 to 47.5%. While rising prices can hinder economic growth by raising uncertainty, declining prices does not necessarily translate to stable growth either. Stable prices over time is more consistent with maximum economic growth. The non-manufacturing price index was lower by 1.3 to 61.2% last month.

Along with the price indexes in the reports, the Macro View has also been interested in the total number of commodity prices going up and commodities that have multiple months of increasing prices. Nothing unusual about the non-manufacturing numbers with 3 multiple month commodities and 9 in total, but for manufacturing there were more commodities going down in price for both categories. Multiple month higher price commodities was 3 and 7 for lower prices and total number of prices going up was 9 compared to 10 in commodities with prices going down.


"Haters" and "Lovers" of the ISM Manufacturing Index
One of the tools we use at Sabrient to development trading models is regression analysis. We find sets of stocks that through back-testing perform better than the comparable index. One set is the lovers that, like the name implies, love the independent variable(s) as it goes up and the other set is a group of stocks that perform well when the independent variable is low (haters). In other words we find stocks that perform well when the economic index is high or rising and also stocks that perform well when the index is low or declining.

With a simplistic model, the non-manufacturing group performed badly in the lovers group and the haters beat the index. But since the data only goes back to the spring of 2005 and overall the manufacturing performed better, let me use that model to provide a few stock ideas based on a regression back test over the last 11 years. Since these results are independent of our ranking system, I also filtered for Strong Buy ratings by Sabrient on the lovers side and Strong Sell along with Sell ratings on the haters side. These results take into account the latest releases by the ISM which were positive as noted above. If the upward trend of the indexes and the overall manufacturing sectors continues to perform well then the lovers group would be expected to outperform the markets.
Lovers:
SCSC Strong Buy
VCI Strong Buy
RHT Strong Buy
GPOR Strong Buy
GCI Strong Buy
LAD Strong Buy
LNC Strong Buy
SNX Strong Buy
HIG Strong Buy
AGCO Strong Buy
PRU Strong Buy
Haters:
HCP Strong Sell
LLTC Sell
VRSN Sell
CTXS Sell
SHAW Sell
T Sell

Disclaimer: The Rock Solid Yield portfolio newsletter is published solely for informational purposes and is not to be construed as advice or a recommendation to specific individuals. Individuals should take into account their personal financial circumstances in acting on any rankings or stock selections provided by Sabrient. Sabrient makes no representations that the techniques used in its rankings or selections will result in or guarantee profits in trading. Trading involves risk, including possible loss of principal and other losses, and past performance is no indication of future results.


Position None:
Full disclosure: The author does not personally hold any of the stocks mentioned in this edition of Rock Solid Yields.


ISM - Media Release: December 2011 Manufacturing ISM Report On Business®

Econoday Report: ISM Mfg Index January 3, 2012

ISM - Media Release: December 2011 Non-Manufacturing ISM Report On Business®

Econoday Report: ISM Non-Mfg Index January 5, 2012

Calculated Risk: ISM Non-Manufacturing Index indicates slightly faster expansion in December


MarketWatch December Forecast:
Manufacturing: 53.0%
Nonmanufacturing: 53.3%

Calculated Risk: Weekly Initial Unemployment Claims decline to 372,000

Calculated Risk: ADP: Private Employment increased 325,000 in December

Want a Job? Go to College, and Don't Major in Architecture - NYTimes.com

Environmental Economics: Chronicle: Unemployment Varies by College Major

Good News On The Jobs Front?

The Capital Spectator: ADP: Job Creation Surged In December

CARPE DIEM: Jobless Claims End 2011 at 3.5 Year Low; And ADP Reports 325K Private Job Gain in December

Strong ADP Jobs Gain Needs Grain of Salt - Real Time Economics - WSJ

David Smith's EconomicsUK.com: Good news from UK manufacturing

Calculated Risk: ISM Manufacturing index indicates faster expansion in December

Calculated Risk: ISM Non-Manufacturing Index indicates slightly faster expansion in December

Vital Signs: Port Traffic Muted - Real Time Economics - WSJ

Vital Signs: More Hotel Rooms Filled - Real Time Economics - WSJ

Vital Signs: More Homes Going Into Contract - Real Time Economics - WSJ

Outside the Bubble, Public Investment Is Disappearing « Multiplier Effect

Personal finance: A layaway to save | The Economist


CARPE DIEM: ND Oil Boom Fuels Real Estate Sales in Arizona

Stumbling and Mumbling: Entitlements & ratchets

Kahneman, Greed and Success, Bryan Caplan | EconLog | Library of Economics and Liberty

The President’s Suspect Statistics We have too little upward mobility, but it has not declined.

Worthwhile Canadian Initiative: The concrete impacts of taxes

Leading Indicators Index Gets Overhaul - Real Time Economics - WSJ


Still in the Woods

*************************************
ISM - Media Release: November 2011 Manufacturing ISM Report On Business®

Econoday Report: ISM Mfg Index December 1, 2011

ISM - Media Release: November 2011 Non-Manufacturing ISM Report On Business®

Econoday Report: ISM Non-Mfg Index December 5, 2011


World-Wide Factory Activity, by Country - Real Time Economics - WSJ

MarketWatch November:
ISM: 52
Non-Manufacturing: 53.9%
U.S. manufacturing lightly accelerates: ISM

The Capital Spectator: Will Manufacturing's November Revival Last?

Calculated Risk: ISM Manufacturing index indicates slightly faster expansion in November

Calculated Risk: Construction Spending increased in October


Misc Links:
Calculated Risk: Employment Summary, Part Time Workers, and Unemployed over 26 Weeks

Calculated Risk: Seasonal Retail Hiring, Duration of Unemployment, Unemployment by Education and Diffusion Indexes

The U.S. Unemployment Rate Falls to 8.6%: Has America Avoided a Double-Dip Recession? - The Curious Capitalist - TIME.com

Mish's Global Economic Trend Analysis: Charts of the Day: Labor Force and Unemployment Rate Adjusted for Population Growth Since 1948 Show Falling Unemployment Rate is "Statistical Mirage"

The Tax Foundation - Overreaching: Time to Reconsider FATCA

What Does The Decline in Labor Force Participation Tell Us « Modeled Behavior

Mankiw: We Need Fiscal Hawks, Monetary Doves, Arnold Kling | EconLog | Library of Economics and Liberty

In Praise of Dirty Energy: There Are Worse Things Than Pollution and We Have Them « Modeled Behavior

Are These Recessions All the Same?, Arnold Kling | EconLog | Library of Economics and Liberty

CARPE DIEM: We Should Thank China for Its Currency Policy

Quotation of the Day…

Judith Scott-Clayton: Student Loan Debt: Who Are the 1%? - NYTimes.com

If there is a recipe for growing too fast forever, I have yet to see it « Modeled Behavior

New evidence that being underwater on your house limits labor mobility — Marginal Revolution

Economist's View: "The Facts about Small Businesses and the Millionaire Surcharge"

Judith Scott-Clayton: Student Loan Debt: Who Are the 1%? - NYTimes.com

Macro Musings That Drive Me Nuts « Modeled Behavior

Soros: World Financial System on Brink of Collapse - Real Time Economics - WSJ

CARPE DIEM: One-Year ARMs Fall to Historical Low

CARPE DIEM: How Terrible: Walmart Plans to "Dump" Six Stores, 1,600 Jobs and $21 Million in Charity on Wash. D.C.

Stumbling and Mumbling: Why stagnation matters

TaxVox » Blog Archive » Top Income Tax Rates and Revenue: A Historical Perspective

Vital Signs: Strong Private Hiring - Real Time Economics - WSJ

Time to Demand Transparency and Accountability at the Fed « Multiplier Effect

Calculated Risk: LPS: Mortgages In Foreclosure Process at an All-Time High

Thinking About CEO Pay, Arnold Kling | EconLog | Library of Economics and Liberty

Top Marginal tax rate of 70% ? | Angry Bear - Financial and Economic Commentary

Who’s Dropping Out of the Labor Force « Modeled Behavior

Mish's Global Economic Trend Analysis: Daily Show on "Free Money"

Calculated Risk: ISM Non-Manufacturing Index indicates slower expansion in November

David Smith's EconomicsUK.com: Service sector growing

Labels: ,

Tuesday, November 01, 2011

Macro View: ISM October,

While the newest ISM reports did not indicate the start of a double-dip recession, both reports were weaker than expected. The Manufacturing ISM Report announced a drop of 0.8 to 50.8% which was below the consensus estimates of 52 and a range of 50.9 to 53% (Econoday Report: ISM Mfg Index). The Non-Manufacturing ISM Report announced an insignificant drop of .1 to 52.9% so that it fell into the consensus range of 52.2 to 54% but was below the consensus point 53.5% that signified that economists were expecting the index to raise 0.6% (Econoday Report: ISM Non-Mfg Index).

Even though the recent reports have shown continued weak and anemic economic growth, there was some surprises in the underlying indexes that could indicate positive news going forward. It was expected that the price pressures would continue to subside indicated by the number of commodities up in price declining along with the price indexes. In fact, the manufacturing report showed more commodities with prices down than up for both multi-month commodities and total commodities. Multi-month commodities up in price was 3 and 6 for commodities down in price, and the numbers for total commodities are 5 and 12 respectively. Thus the price indexes also dropped, for example the significant drop of the non-manufacturing index by 4.8 to 57.1%. Even more surprising was the manufacturing price index dropped an amazing 15 points to 41%. Also the net percent of respondents stating that prices were lower minus those responding higher changed from a positive 12 to a negative 18. This is even more significant drop since it plunged below the break even point of 50 (more precisely 49.4%). The report noted the significance of these events below along with the graphs for commodities with rising prices for manufacturing and non-manufacturing.
This is the sixth consecutive month the prices index has registered below 80 percent since December 2010, and is the first month of contraction since May 2009 when the index registered 43.5 percent. The last time the Prices Index decreased more than 15 percentage points was in June 2010, when it registered 57 percent compared to the prior month's reading of 77.5 percent.


Picking up steam or grasping at straws?
One bit of good news was that the manufacturing index for new orders reversed from negative territory to expansion after 3 months of contraction. The index rose by 2.8 to 52.4%. This may be a positive sign going forward but it seems too little and too late to be an important factor in the recovery. On the other hand, new orders dropped 4.1 to 52.4 for non-manufacturing index.

The biggest surprise from the reports was the non-manufacturing employment index reversed its short term declining trend below the break even point of 50, and the index jumped a descent 4.6 points to 53.3%. I certainly expected it to stay under 50 even if it was expected to increase over last months low of 48.7%. Below is a graph showing the non-manufacturing index since December 2009.


Looking forward
Even with the few positive signs, the problems the US economy faces is much larger than a one month expansion in new orders or reversal of short term employment trends. The biggest problem is arguably unemployment staying stuck in the 9% range. And only heaven knows how the Euro-crisis will be resolved. Greece may be small potatoes for the world economy, but if the financial problems topple over other unstable governments and financial institutions, then it will be hard to predict how far the contagion will grow.


MarketWatch:
ISM: 52.1
Services: 53.5

The Capital Spectator: Major Asset Classes | Oct 31, 2011 | Performance Update

Calculated Risk: ISM Manufacturing index indicates slower expansion in October

Calculated Risk: ISM Non-Manufacturing Index indicates expansion in October


Misc. Links:
Calculated Risk: Preliminary Vehicle Sales for October

David Smith's EconomicsUK.com: GDP calm in the storm

Mish's Global Economic Trend Analysis: GM Sales Barely Rise, Chrysler's Up 27%; What Does It Mean?

Calculated Risk: Construction Spending increased slightly in September

The euro crisis: Eurodoom | The Economist

Economist's View: "How My Taxes are Raised Matters"

Economics - Australia lowers interest rate to 4.5%

Bruce Bartlett: A Close Look at the Perry Tax Plan - NYTimes.com

UK economy: Pretty Q3; ugly Q4 | The Economist

Economists React: U.K. Data No Cause for Celebration - Real Time Economics - WSJ

Class War Within a Class War

Payday Loans - Thomas Sowell - Townhall Conservative

Political Calculations: Projecting Fourth Quarter 2011's GDP

Midwest Economy: District Economy Update

Fiction Made in America

Class War Within a Class War

Environmental Economics: Blaming economists for our current economic situation is like blaming psychologists because people are crazy

Division of Labour: November 2011 Archives

Mish's Global Economic Trend Analysis: Bank of America Employees Flood Rivals with Resumes; BNP, ING Book Charges on Greek Debt, Slash Jobs; "Project New BAC" on Rip-Roaring Start

Tea Party vs. OWS: The psychology and ideology of responsibility | The Moral Sciences Club | Big Think

Consumers Remain Pessimistic - Real Time Economics - WSJ

Labels: ,

Thursday, October 06, 2011

A Macro View: ISM September, Trends Ending, Now What

The reports on Business by the Institute of Supply Management (ISM) showed overall positive news even with a marginally lower headline NMI for the non-manufacturing sectors by 0.3 to 53%. Both headline numbers came above consensus of 50.5 & 50.6 with actual number of 51.6% for manufacturing, and consensus of 52.7 & 52.9 with actual number of 53% for non-manufacturing. Both were within the consensus ranges provided from Econoday with a range of 49 to 52% for manufacturing and 51.3 to 54.2% for non-manufacturing.

Comparing the US manufacturing index to World-Wide Factory Activity indexes shows that the US was among the minority that experienced growing expansion of the manufacturing index. Over two-thirds of the sample countries experienced a drop in the month-over-month index. The positive news of the US manufacturing increasing the index by 1% even inspired economist Dan Greenhaus of BTIG LLC to conclude that the "United States was not in a recession in the third quarter". Considering that the manufacturing sectors of the economy is minority share of the US economy, I would not be so confident of such declarations.

Trends are Over
Technically, there may be little possibility of a double dip recession coming now, but with unemployment stubbornly staying above 9%, then hardly anyone will be considering the US economy being healthy. That opinion would be widely agreed to from Tea Party members to Occupy Wall Street (OWS) crowds.

A major concern of this blog, the Macro View of the Markets, is the price indexes in the ISM reports and commodities with rising prices. The price index for manufacturing increased slightly to 56% by 0.5 and dropped 2.3 to 61.9% for non-manufacturing. From a macro perspective on the economy, price indexes in the mid fifties to low sixties might be good for now considering the overhanging threat of deflation. This blog also has been tracking and graphing the number of commodities up in price and commodities that have multi-months with rising prices. (Below are the two graphs of manufacturing and non-manufacturing respectively.)


Until the economy starts heating up again, or more precisely the world wide economy, then worries about commodity prices and price levels is of secondary concerns compared to the unemployment rate and this has been at least partially derived from business confidence. Recently we have seen the numbers in both categories on a downward trend. This trend ends when it is no longer reasonable to decline further and in this case zero bound limit. There was a trend up for all four indicators until around April or May of this year and now it has declined to reasonable levels.

The other index of great importance to the Macro View is the employment index of the non-manufacturing sectors. Below is a graph of that index that clearly shows the upward trend we were seeing has ended and is now in a downward trend line. Not only do we have visual confirmation of the shift in the trend line but the R squared statistic has dropped dramatically from its high of nearly 0.75 to under 0.49 last month and from 0.63 the previous month. Statistically both trends have p values of less than one percent, indicating that both trend lines are significant and separate. The trend line is drawn just to show the dramatic shift from the previous trend line.


Respondent's Uncertainty
Pundits of the US economy often point to reports that state business have more concern about lack of demand than regulations or just general financial uncertainty. One such prominent pundit is Paul Krugman where he stated the following at the article The Fatal Distraction .
O.K., I know what the usual suspects will say — namely, that fears of regulation and higher taxes are holding businesses back. But this is just a right-wing fantasy. Multiple surveys have shown that lack of demand — a lack that is being exacerbated by government cutbacks — is the overwhelming problem businesses face, with regulation and taxes barely even in the picture.

For example, when McClatchy Newspapers recently canvassed a random selection of small-business owners to find out what was hurting them, not a single one complained about regulation of his or her industry, and few complained much about taxes. And did I mention that profits after taxes, as a share of national income, are at record levels?

Below is a sample of quotes from respondents in the reports. There is no way to know how widespread these feelings are, but it is reasonable to assume that the ISM picks these quotes to try and capture the general sentiment of their members. The first quote is a damning critique of Krugman's assertions and that is reiterated by the second quote from the issuer of the manufacturing report.
Manufacturing:
"The economy continues to be a drag on our business outlook. We are trying to deal with new and additional FDA regulations which are costing significant dollars. It is hard to recoup any of these additional costs in our pricing levels without losing significant sales volumes." (Chemical Products)

Comments from respondents generally reflect concern over the sluggish economy, political and policy uncertainty in Washington, and forecasts of ongoing high unemployment that will continue to put pressure on demand for manufactured products." Bradley J. Holcomb, CPSM, CPSD, chair of the Institute for Supply Management™ Manufacturing Business Survey Committee

"Japan supply chain issues are over, but exchange rates and raw material prices are hurting our profit." (Transportation Equipment)

Non-Manufacturing:
Respondents' comments reflect an uncertainty about future business conditions and the direction of the economy. Anthony Nieves, C.P.M., CFPM, chair of the Institute for Supply Management™ Non-Manufacturing Business Survey Committee

"It appears everyone is waiting to see what happens next. No trust in the economy or the federal government to do what is needed." (Accommodation & Food Services)

"The 2012 outlook is not optimistic; though we keep hoping for a rebound, we see little sign of an improved economy — nothing at least that will spur growth, investment or expansion. Improved investment performance in early 2011 caused us to begin several large capital projects, and although we have broken ground, we cannot help but question if our timing was right." (Educational Services)

"Third and fourth quarters appear to be slowing down in order volumes. Uncertainty over U.S. and European economy is causing clients to hold off on new orders." (Professional, Scientific & Technical Services)

Conclusion
This might be the start of the business communities changing attitudes and concerns. That being, that government is clearly the hindrance to business expansion and greater investment levels. It is hard to think how the OWS movement will increase business confidence and willingness to take on greater risks through expanded investments.

The positive trend upward for the employment index in the non-manufacturing report has officially been defeated. Not a good sign for the unemployment rate going forward. Even though new orders in that same report showed greater expansion with a rise in the index of 3.7 to a healthy 56.5%, the percentage of respondents stating higher growth in new orders actually fell last month. The index rose because those reporting contraction in new orders fell greater. Thus the number of respondents stating that new orders maintained the same level rose to 60% from 50%.


MarketWatch:
ISM: 50.6
Non-Man: 52.7%


Econbrowser: Slow growth continues


Calculated Risk: ISM Non-Manufacturing Index indicates expansion in September


Vital Signs: Slower Service-Sector Growth - Real Time Economics - WSJ

The Great Stagnation in the UK

Mish's Global Economic Trend Analysis: Ben Bernanke Fans Fires of Protectionist Legislation to Senate Joint Economic Committee; Expect Global Depression if Obama Signs On

CARPE DIEM: Intermodal Rail Traffic Highest in Four Years

Mics Links of Interest:
An Economic Bill of Rights, Arnold Kling | EconLog | Library of Economics and Liberty

The Tax Foundation - How Do You Tax a Millionaire? First, You Get a Millionaire

Trickle Down

Mish's Global Economic Trend Analysis: How Ben Bernanke "F*d" the Banks and Fixed Income Savers at the Same Time

How Fast Does the Stock Market Forget False News? About Seven Days « Donald Marron

Are There Too Many Homes in America: Apartment Vacancies and New Units Approaching Record Lows «  Modeled Behavior

Labels: ,

Monday, September 12, 2011

A Macro View: ISM August, Trendline Friend or Foe

While the markets had bigger worries than the little ISM reports, both headline numbers of the reports were above consensus expectations. The PMI for manufacturing was three tenths lower than last months number at 50.6% but well above the consensus of 48.5 which was expecting a drop of almost 2 1/2 points. The NMI for non-manufacturing was nicely up .6 to 53.3% which the consensus was expecting a drop of 1.7 to 51%. Both were neatly in the consensus range provided by Econoday with the PMI range of 47 to 51.9% and the NMI range of 49.7 to 56.6%. Looking at the ranges of the consensus, the NMI range as usual is broader. This may reflect that the economists find it harder predicting the non-manufacturing sectors. I do question the one or more economists that thought the NMI would jump nearly 4 points last month.

Overall, the headline numbers were better than expected, but that was based on gloomy forecasts overall. The US was definitely not alone in the manufacturing sectors contracting as noted by World-Wide Factory Activity showed only four countries having higher index numbers in August and 18 countries having negative change month over month.

Trends Are Our Friends ... Or Not
Employment is one of the sub-indexes that the Macro View of the Markets looks at for trends. These are important issues when considering that this weak recovery could be called a "jobless recovery". The graph below is from the Federal Reserve (FRED - Economic Data) which shows two trends. The first starts at February 2009 and peaks at February 2011 with a strong upward trend. The second trend is a downward trend since this February. Whether the second downward pressure persists is the question, and a drop of the latest 1.7 points to 51.8% is a negative indicator for continuing employment growth in manufacturing.


The chart below shows the non-manufacturing employment index with a trend line since December 2009. The slope of the trend line has been declining since at least March 2011. Even before the trend line drops to zero, there is likely to be the start of a downward trend. That is the question we are facing now with the last two months dropping below trend. If the short term trend continues this would mean contraction in the non-manufacturing sectors and the prospect of decent job growth along with it.


The following two graphs shows the number of commodities with multi-month price rises and then total number of commodities rising in price for both manufacturing and non-manufacturing sectors respectively. All four series peaked in April or May of this year creating an upward trend since October 2010 and then a general downward trend since its peak. No trend can continue past the zero-bound limit as in this case. It is important to look at trends since the index numbers are not completely independent events. One month's numbers are likely to follow closely to the last months numbers plus a possible trend factor. The factors and forces causing the respondents attitudes and thus responses in the ISM reports are likely to carry over from one month to another. Even the business cycle theory would have to consider a stochastic process for determining the next stage in the cycle.


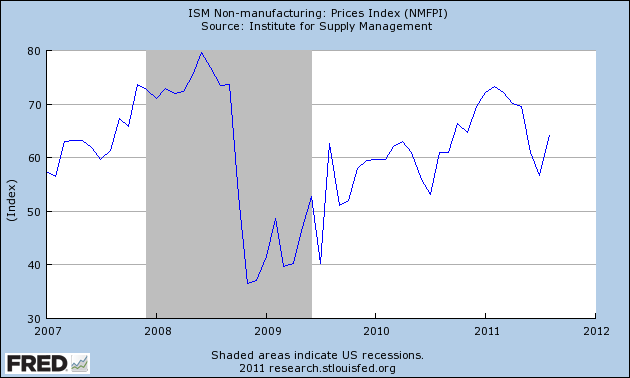
The following two graphs, from Fred Economic Data, shows a recent downward trend for manufacturing with the index dropping 3.5 points to 55.5%. But non-manufacturing has reversed its recent down trend and jumped up 7.6 points to 64.2%. Not that it is a perfect correlation, but input prices have shown a positive correlation with the growth of industries. Take this month, the NMI increased and so did the price index for non-manufacturing, while the PMI declined along with the price index in manufacturing.


That correlation was only based on one month observations but I think it is more broadly applicable than that. That as the economy heats up for the US and thus worldwide expansion also then commodity prices start rising dramatically. This then leads to the economy cooling as a result of higher commodity prices. The weak economy then drives down demand for commodities and then the cycle begins again. Another way of describing this phenomenon is at Our Oil-Constrained Future.
If this model is accurate—and if the ceiling on global oil production really is around 90 mbd and can be expanded only slowly—it means that every time the global economy starts to reach even moderate growth rates, demand for oil will quickly bump up against supply constraints, prices will spike, and we'll be thrown back into recession. Rinse and repeat.


Conclusion and Trends
Overall the ISM reports were better than expected, but fall short of dispelling rumors of a second dip recession. Hopefully, the constraints on economic growth caused by slingshot effects of growth and commodity prices will be solved someday. Maybe by increased production in Libya or Iraq. But these constraints will likely persist until the structural rigidity problems of the US are solved.

This post talked about trends in general terms and avoided too much statistical jargon, and we could have explored more about knowing when a trend has structurally changed or was it just slight deviance from the norm or just an anomaly in the data set. These general discussions should be enough to understand that the graph below does not show a trend line but simply the average over the extreme long term data points.

The first reaction from a technical perspective is that the scale should be log at least on the vertical axis. At the least the numbers should have been adjusted by something like the GDP deflator that adjusts for the value of the dollar over time, especially over long periods of time. Even with these adjustments it might not help since the underlying data appears to be nominal stock prices and not total market cap. That is, what is measured is not value but the arbitrary amounts of money traded for a share. A company can control outstanding shares and thus the price of their share through dilution or stock splits or even reverse stock splits. Lastly, a trend line should go through as many points as possible and be close to the data points. This "trend line" only has one point in common with the data set, and the origin point is immaterial.


And I Will Say It Again....: Why David Trainer is an Idiot


MarketWatch:
ISM Man: 49---48.5%
Non-Man: 51.2%

ISM Manufacturing Comes In Better Than Expected, But Still Weak - Seeking Alpha


The Capital Spectator: A Bit Of Good News For The Services Sector

Good News on ISM «  Modeled Behavior

Mish's Global Economic Trend Analysis: Manufacturing ISM Dips Slightly, Barely Above Contraction, Saved by Inventory Growth, Much Weaker than it Looks

The Capital Spectator: Manufacturing Growth Weakens In August

ISM Manufacturing Comes In Better Than Expected, But Still Weak - Seeking Alpha


Calculated Risk: ISM Non-Manufacturing Index indicates expansion in August


Economists React: U.K. ‘Bright Spot’ Dims - Real Time Economics - WSJ

Calculated Risk: Texas Manufacturing Activity "Flat" in August


Misc. Links:
CARPE DIEM: More On 3-Year Inflation Being Lowest in 54 Years

Calculated Risk: ISM Manufacturing index declines slightly to 50.6

CARPE DIEM: Real Consumer Spending Up in July to Record High

August Sales: How Retailers Fared - Real Time Economics - WSJ

Calculated Risk: Pending Home Sales decreased in July

The Sabrient Blog » The Fed’s Bazooka: Revealed As Final Policy Firepower in Jackson Hole

Macro and Other Market Musings: Does Higher Expected Inflation Really Spur Spending?


Stephen Williamson: New Monetarist Economics: Has Politics Paralyzed the Fed?

Mish's Global Economic Trend Analysis: Bernanke's Invisible Bazooka Ploy

The Capital Spectator: Jobless Claims Fell Last Week, But So What?

Econbrowser: The CPI, and Some Key Components

Calculated Risk: Weekly Initial Unemployment Claims decline to 409,000

Calculated Risk: Employment Situation Preview: Another Weak Report

Calculated Risk: Construction Spending declined in July

Are There Too Many Homes in America, Ctd «  Modeled Behavior

Macro and Other Market Musings: The Fed Gets Schooled Again on Central Banking: the Swiss National Bank Edition

Political Calculations: A Slightly Better Than Zero Jobs Report

The breaking windows fallacy — Marginal Revolution

Labels: ,

Sunday, August 07, 2011

A Macro View: ISM Reports-July

This last week has seen wild swings in the markets and certainly the ISM reports did not help the mood of pessimism. Starting Monday, the markets got a significant jump up of almost 140 points on the DJIA, but the mood changed as soon as the July 2011 Manufacturing ISM Report (PMI) was released at 10am. Although Wednesday was up slightly for the day, the July 2011 Non-Manufacturing ISM (NMI) also reversed the up direction at 10am.

The markets were reacting to the headline numbers as both were below the consensus marks of 54.3% versus the actual of 50.9% for PMI and 53% versus 52.7% for NMI. The market also reacted more dramatically on the PMI, presumably because it also missed the consensus range of 52 to 55.4% as numbers reported by Econoday.

Before the two reports came out, leading economics bloggers became gloomy on the economic outlook, and the report said “optimism is out; pessimism is in,”. Professional economists reacted by stating the manufacturing report was Very Weak, Very Disappointing. Plenty of economics bloggers also wrote about the reports like the following linked list.
1. The Capital Spectator: US Manufacturing Activity Slows Sharply In July
2.
Manufacturing Slows In July, Stoking Slowdown Fears
3.
Mish's Global Economic Trend Analysis: Gap-and-Crap it Was; ISM Plunges to 50.9, Lowest Level in 2 Years, New Orders Contract; Key Thoughts; Reaction in Gold

4. Calculated Risk: ISM Manufacturing index declines in July

5. Mish's Global Economic Trend Analysis: ISM says "Business Conditions Flattening Out"; Why Services Number Worse Than It Looks; Unsustainable Conditions

6. Calculated Risk: ISM Non-Manufacturing Index indicates slower expansion in July

7. Manufacturing Weakens, But It's Not a Death Knell - Seeking Alpha/Calafia Beach Pundit

8. A Bright Spot in the ISM Report? - Seeking Alpha/Cullen Roche

Interestingly enough the last two links hint that the time to abandon ship has not yet arrived. Calafia Beach Pundit (CBP) makes an important point that just because the manufacturing sector is slowing in growth, the correlation between GDP growth and PMI is not at the break even point of 50 but is 47%. The last manufacturing report stated:
"The past relationship between the PMI and the overall economy indicates that the average PMI for January through July (57.6 percent) corresponds to a 5.3 percent increase in real gross domestic product (GDP). In addition, if the PMI for July (50.9 percent) is annualized, it corresponds to a 2.9 percent increase in real GDP annually."

But when looking at the chart by CBP (below) it looks like this business cycle has diverged from the expected outputs. The biggest spikes in PMI has not resulted in the same magnitude of spikes in GDP, and more importantly is the divergence between PMI and GDP during this business cycle. Maybe it was a weaker non-manufacturing sector that did not contribute the same magnitude as other business cycles. Looking at the last major spike in the PMI index at around 2004, it still showed a solid growth in GDP with even the lows well above the 2% mark. This time the first two quarter GDP growth has just dropped off during the spike to just above no growth. (Below is a more detailed (esoteric) discussion about correlations between GDP and the PMI indexes.)

Cullen Roche tells us the bright spot in the ISM report is that inflation fears by hyperinflationistas (my word) should go away now. But the other side of the story is that this just means lack of aggregate demand in the economy. Right now we need an economy more like China than Japan as Roche contrasted, that is higher inflation rates and higher growth rates. No way we can achieve that high of growth due the size of the economy and so much structural rigidity built into the system.

In addition to the fact that the manufacturing price index has dropped a 'staggering' 26.5% over the last 4 months, both indexes dropped below the 60 mark with a drop of 9 to 59% and 4.3 to 56.6% for manufacturing and non-manufacturing respectively. It seems reasonable that moderate levels of inflation is good for the economy and thus moderately rising prices for the sectors is fine. Even the Fed targets moderate inflation levels of around 2%. Below is graphs of the manufacturing and non-manufacturing commodities up in price that includes multi-month commodities up in price and total number of commodities up in price. Manufacturing shows the continued reduction in both categories, but there was a slight increase of total commodities up for non-manufacturing. Still nothing to be worried about for now.


Overall there really is not much of a silver lining in either report. The biggest positive in either report was the Business Activity index in the non-manufacturing report with a gain of 2.7 to 56.1%. Even that may not be sustainable as new orders and employment both dropped 1.9 and 1.6 respectively. Imports increased in both reports but big deal. As discussed before, it does not hurt our economy overall but this comes with shrinkage in the non-manufacturing New Exports index by 8 to 49%.

The all important employment indexes were significantly lower last month as manufacturing dropped 6.4 to 53.5% and non-manufacturing eased lower by 1.6 to 52.5%. Below is the updated employment index for non-manufacturing along with its trend line since December 2009. Three other times it has eased below the trend line as drawn, but this looks like a more significant change than previous below trend changes. The whole trend has been tenuous at best. This does not bode well for rapid reduction in the unemployment rate in the short term.


Last month I explored how the ISM headline indexes (PMI, NMI) are calculated. The PMI used 5 sub-indexes of equal weight, and the NMI used 4 which are seasonally adjusted in both reports. According to the ISM web site (Reports On Business: Overview), there is a close correlation between the PMI and growth of the economy or specifically GDP.
An update of research originally done by Theodore S. Torda, the late economist for the DOC, shows a close parallel between growth in real Gross Domestic Product (GDP) and the PMI. The index can explain about 60 percent of the annual variation in GDP, with a margin of error that averaged ± .48 percent during the last ten years. George McKittrick, an economist at the DOC, said "Not only does the PMI track well with the overall economy, but the indication provided by ISM data about how widespread changes are, complements analogous government series that show size and direction of change."

I did not get as significant of correlation when doing linear regression analysis on GDP and the PMI, but this may be due to different data sets or adjustments made to the data sets. The Ordinary Least Squares shows that 52 2/3 of the variance in GDP is attributable to changes in the PMI index. The sign of the slope is of the correct sign (positively correlated) and the T-Ratio probability (p-value) is 0.000. Since this OLS produces a failed test for functional form, I tried the regression on log of the PMI. This resulted in an adjusted R^2 rising slightly to .548 with a better diagnostic test for functional form. Although there is a high degree of correlation between the PMI and NMI, it still made sense to combine the two in a regression. The NMI variable was significant at the 5% level but failed at the 1% while the PMI retained the 0.000 p-value. This increased the adjusted R^2 to .609. Lastly, taking the logs of PMI and NMI gave the same significant levels as the last but increased the adjusted R^2 to .631. Below shows the scatter relationship between GDP growth and the PMI index.

The question then should be is how do the other economic indicators compare with these results? Below is a table of some of the results including what was already discussed.

As observed from the table above, none of the other economic indexes are nearly as correlated with GDP. Even the index of Leading Economic Indicators (LEI) resulted in no significant correlation. Since this is a "leading" indicator, using lags resulted in some significance for 2 to 6 month lags but still not nearly as strong as correlation with PMI. When I regressed GDP on the independent variables of PMI and LEI resulted in higher adjusted R^2 but the slope of the LEI becomes negative. This indicates that as LEI increases it would signify slower GDP growth. Obviously, the opposite sign as expected. Even Housing Starts did not have any significance with as many as 24 lags out. The slope coefficient was of the correct sign (positive) for current index and up to 4 period lags (months) but none are significant at even the 0.1 level.

Back in August 2010, I asked if the ISM is an overrated index? At least with respect to the GDP, it certainly is not. Some further questions for investors is how GDP growth or lack of growth affects the equity markets or at the sector levels of the economy? Can investors use the ISM reports as an investing strategy, and how effective is such models? For further discussions and links on these questions look at the section titled Using the ISM Cycle as an Investment Guide in the May ISM reports post.


MarketWatch:
ISM: 54.3%
ISM Non-manufacturing: 53.3%

Misc. Links:
That Was The Inflation Scare That Was

David Smith's EconomicsUK.com: Where's the manufacturing growth?

FT Alphaville » What price UK QE2?

PMI Reports Show Slowing Global Economy - Seeking Alpha

Mish's Global Economic Trend Analysis: Durable Goods Orders Sink 2.1%, Non-Defense Orders Sink 4.1%


Calculated Risk: Kansas City Manufacturing Survey: Manufacturing activity slows in July

Inflation Still Alive and Well at the Producer Level - Seeking Alpha

Worrying Weak Macro Trends in China, U.S. and Europe

Philly Fed: Regional Manufacturing Remains Weak

China's July PMI: Definite Economic Contraction Underway

Calculated Risk: Fed's Williams: The Economic Outlook

Political Calculations: Changing Perspective on New Unemployment Claims

macroblog: Lots of ground to cover


Calculated Risk: Pending Home Sales increase in June

Mish's Global Economic Trend Analysis: Gap-and-Crap it Was; ISM Plunges to 50.9, Lowest Level in 2 Years, New Orders Contract; Key Thoughts; Reaction in Gold

When Dollar Stores Are Too Expensive You know the economy is in bad shape when customers can't afford to shop at dollar stores anymore.

Calculated Risk: States cutting Unemployment Insurance benefits

Revised GDP Numbers Look A Lot More Like Retail Sales «  Modeled Behavior


Labels: