Macro View: ISM May Rose Flowers or Thorns?
At some time the negative news surprises are going to be supplying the bears with all the nutrients they need to roar back to life. Over the past week, David Brown noted that the markets were thinking “What? Me worry?” over the triple whammy of bad news from housing, business conditions and consumer confidence. Obviously these three segments are most important for the economy to get back on the right tract and unemployment to decrease from present high levels. This could be a harbinger of a vicious circle forming through negative outlooks spreading throughout the economy. The next day Scott Martindale noted the bearish indicators were showing signs of trouble where he stated that Financials are a drag.
While the VIX (a measure of market volatility) has remained subdued, some of the negative news this week has been: Case-Shiller home prices are contracting; consumer confidence was significantly below expectations; ADP employment report was reported as a measely 38,000; ISM manufacturing report confirmed the downdraft reported by the Chicago PMI with a drop of nearly 7%; motor vehicle sales was below expectations; Factory Orders were down; and to top it off, the unemployment rate rose slightly to 9.1%. The SPY showed weakness this month with a drop of around 2 1/4% on June first, marginally lower on the second and nearly a 1% drop on Friday. One bit of good news was that the Non-manufacturing ISM report was above expectations with an increase of 1.8 to 54.6%.
The WSJ's World-Wide Factory Activity by country shows that most countries have turned to slowing rates of growth with a general convergence toward the mid-50s range. The two outliers are Spain and Greece that are contracting at a faster significant pace -- as expected.
As noted above, the ISM manufacturing headline index dropped 6.9 to 53.5% which was below MarketWatch consensus of 57.1 and Thompson Reuters of 57.5% with a range of 55 to 59.5%. While the manufacturing was a surprise to the downside which was below the consensus range, the non-manufacturing index was a surprise to the upside at 54.6% versus the consensus from MarketWatch and TR both at 54 and a TR consensus range of 52 to 55%.
Jobs, Jobs, Jobs
The manufacturing employment index has continued its downward trend since February 2011 with a high of 64.5 and a most recent drop of 4.5 to 58.2%. This drop below the 60 mark might signify slower employment growth in reports like the ADP employment report for manufacturing. Since manufacturing has less share of total employment than the services sectors, the non-manufacturing employment index has been of more interest to us. The graph below shows the non-manufacturing employment index since December 2009. Worth noting is that the drop from April was reversed and May just about reached the trend line as it did this March. (Click on charts for clearer images.)

Prices and Commodities
Mish noted that the Manufacturing ISM plunged along with backlog of orders and new orders with the later barely above contraction. He also notes that all the indexes dropped in the table by ISM, but not all indexes are bad news when they drop, especially prices. Both price indexes went down with the manufacturing dropping a sizable amount of 9 to 76.5% and non-manufacturing declining slightly to 69.6 by .5%. This trend might be a good sign, but it seems to accompany soft economic growth indicators, which is not necessarily good news overall.
More troubling is the number of commodity prices rising along with commodities that have risen for consecutive months. The two graphs below show the number of multi-month commodities with price increases and total number of commodities with rising prices since November 2010 for the manufacturing and non-manufacturing sectors respectively.


While both categories for manufacturing decreased in May, non-manufacturing continued the upward trend with both hitting new highs. Mish concludes about the price pressures and I agree with:
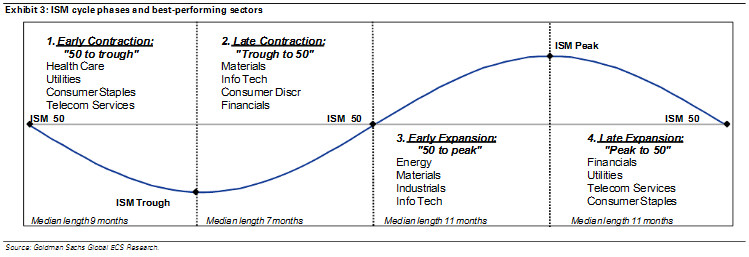
Using the ISM Cycle as an Investment Guide
Hat tip to Cullen Roche with the above linked titled article that uses the ISM manufacturing index as an investment strategy developed by Goldman Sachs. A partial explanation for the strategy is available at "Weekly Kickstart" (premium pdf report at: https://360.gs.com/gs/portal/?st=1&action=action.binary&d=10967056&fn=/document.pdf) And we are seeing that the manufacturing index has continued its decline since this February's peak with a sharp decline in May. If this trend continues it will certainly mean contraction in the coming months, and possible signs of a "double-dip" recession.
Mr. Roche links to an article about headline non-manufacturing sector declining in April to confirm the reversal of the faster growth rates, but the May report for the non-manufacturing sectors actually reversed course and increased the rate of growth. GS specifically states the manufacturing ISM reports are the basis for the strategy, and if this is a proxy for growth of the economy then the manufacturing is more strongly correlated with GDP growth. This correlation is confirmed from the statements from the ISM reports, reports from Martin Evans from the National Bureau of Economic Research in a paper entitled "Where Are We Now? Real-Time Estimates of the Macroeconomy", and my own regressions done on the data. I would expect that this correlation with manufacturing and GDP growth would become weaker in the future as the manufacturing portion of the economy continues to decline. Just as the US no longer sees any correlations between agricultural production and GDP, but in India the monsoons and weather patterns are highly correlated with economic growth.
The GS investment strategy using ISM data is summed up by the following graph. If the manufacturing index continues its downward spiral then the length of this lag has been shorter than the median of 11 months with only 5 months. As they say, "Every cycle is unique and return distributions are wide." Caution should be practiced at trying any new strategy, but it does add to the plethora of business cycle investing strategies.
MarketWatch:
ISM: 57.1%
Non-Manufacturing: 54.0%
World-Wide Factory Activity, by Country - Real Time Economics - WSJ
ISM - Media Release: May 2011 Manufacturing ISM Report On Business®
Econoday Report: ISM Mfg Index June 1, 2011
ISM - Media Release: May 2011 Non-Manufacturing ISM Report On Business®
Econoday Report: ISM Non-Mfg Index June 3, 2011
Calculated Risk: ISM Non-Manufacturing Index indicates slightly faster expansion in May
The Capital Spectator: The New Decline In The Inflation Forecast
Chicago PMI Tanks in May - Seeking Alpha
Calculated Risk: ISM Manufacturing index declines to 53.5 in May
David Smith's EconomicsUK.com: Manufacturing growth weakens
American government debt: Mining the safe harbour | The Economist
Mish's Global Economic Trend Analysis: Case-Shiller Nominal and Real Housing Declines Since Peak; Home Prices Best in 25 Years, Better Prices Still Coming
The Capital Spectator: Two More Warning Signs For The Economy
Calculated Risk: Chicago PMI shows sharply slower growth, Manufacturing Activity Expands in Texas
Chicago Business Barometer Shows Weakening Recovery - Real Time Economics - WSJ
The Unkillable Yield Curve Fallacy (Wonkish)
Inflation and Debt (Wonkish)
Inflation Notes
Calculated Risk: Arizona Lands sells for 8 percent of peak price
Misc. Links:
Using the ISM Cycle as an Investment Guide - Seeking Alpha
U.S. Manufacturing Trade (Wonkish){PK}
Supercore! (Wonkish) Two questions about inflation: {PK}
Questions for Minimum Wage Supporters, Bryan Caplan | EconLog | Library of Economics and Liberty
Mish's Global Economic Trend Analysis: Retail Sales Plunge in Italy, Dip Elsewhere in Euro-Zone
Worthwhile Canadian Initiative: Subsidies on Interest Income to increase Aggregate Demand
Bad News In Preliminary Jobs Data
Calculated Risk: ADP: Private Employment increased by 38,000 in May
Why do Depressions Occur?, Arnold Kling | EconLog | Library of Economics and Liberty
Calculated Risk: Employment Summary, Part Time Workers, and Unemployed over 26 Weeks
GOP, Democrats Point Fingers Over Rising Unemployment Rate - Washington Wire - WSJ
Nearly 1 in 3 Unemployed Out of Work More Than a Year - Real Time Economics - WSJ
Video: Weak Jobs Report for May - Real Time Economics - WSJ
Job numbers disapoint and the unemployment rates rises: Is it Time for more stimulus? - The Curious Capitalist - TIME.com
The Capital Spectator: Job Creation Slows Sharply In May
While the VIX (a measure of market volatility) has remained subdued, some of the negative news this week has been: Case-Shiller home prices are contracting; consumer confidence was significantly below expectations; ADP employment report was reported as a measely 38,000; ISM manufacturing report confirmed the downdraft reported by the Chicago PMI with a drop of nearly 7%; motor vehicle sales was below expectations; Factory Orders were down; and to top it off, the unemployment rate rose slightly to 9.1%. The SPY showed weakness this month with a drop of around 2 1/4% on June first, marginally lower on the second and nearly a 1% drop on Friday. One bit of good news was that the Non-manufacturing ISM report was above expectations with an increase of 1.8 to 54.6%.
The WSJ's World-Wide Factory Activity by country shows that most countries have turned to slowing rates of growth with a general convergence toward the mid-50s range. The two outliers are Spain and Greece that are contracting at a faster significant pace -- as expected.
As noted above, the ISM manufacturing headline index dropped 6.9 to 53.5% which was below MarketWatch consensus of 57.1 and Thompson Reuters of 57.5% with a range of 55 to 59.5%. While the manufacturing was a surprise to the downside which was below the consensus range, the non-manufacturing index was a surprise to the upside at 54.6% versus the consensus from MarketWatch and TR both at 54 and a TR consensus range of 52 to 55%.
Jobs, Jobs, Jobs
The manufacturing employment index has continued its downward trend since February 2011 with a high of 64.5 and a most recent drop of 4.5 to 58.2%. This drop below the 60 mark might signify slower employment growth in reports like the ADP employment report for manufacturing. Since manufacturing has less share of total employment than the services sectors, the non-manufacturing employment index has been of more interest to us. The graph below shows the non-manufacturing employment index since December 2009. Worth noting is that the drop from April was reversed and May just about reached the trend line as it did this March. (Click on charts for clearer images.)

Prices and Commodities
Mish noted that the Manufacturing ISM plunged along with backlog of orders and new orders with the later barely above contraction. He also notes that all the indexes dropped in the table by ISM, but not all indexes are bad news when they drop, especially prices. Both price indexes went down with the manufacturing dropping a sizable amount of 9 to 76.5% and non-manufacturing declining slightly to 69.6 by .5%. This trend might be a good sign, but it seems to accompany soft economic growth indicators, which is not necessarily good news overall.
More troubling is the number of commodity prices rising along with commodities that have risen for consecutive months. The two graphs below show the number of multi-month commodities with price increases and total number of commodities with rising prices since November 2010 for the manufacturing and non-manufacturing sectors respectively.

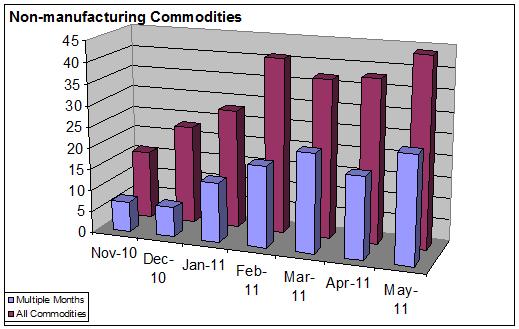
While both categories for manufacturing decreased in May, non-manufacturing continued the upward trend with both hitting new highs. Mish concludes about the price pressures and I agree with:
Either commodity prices plunge, or manufacturers get hit in a price and profit squeeze with falling customer demand.
Which will happen? I think both.
Using the ISM Cycle as an Investment Guide
Hat tip to Cullen Roche with the above linked titled article that uses the ISM manufacturing index as an investment strategy developed by Goldman Sachs. A partial explanation for the strategy is available at "Weekly Kickstart" (premium pdf report at: https://360.gs.com/gs/portal/?st=1&action=action.binary&d=10967056&fn=/document.pdf) And we are seeing that the manufacturing index has continued its decline since this February's peak with a sharp decline in May. If this trend continues it will certainly mean contraction in the coming months, and possible signs of a "double-dip" recession.
Mr. Roche links to an article about headline non-manufacturing sector declining in April to confirm the reversal of the faster growth rates, but the May report for the non-manufacturing sectors actually reversed course and increased the rate of growth. GS specifically states the manufacturing ISM reports are the basis for the strategy, and if this is a proxy for growth of the economy then the manufacturing is more strongly correlated with GDP growth. This correlation is confirmed from the statements from the ISM reports, reports from Martin Evans from the National Bureau of Economic Research in a paper entitled "Where Are We Now? Real-Time Estimates of the Macroeconomy", and my own regressions done on the data. I would expect that this correlation with manufacturing and GDP growth would become weaker in the future as the manufacturing portion of the economy continues to decline. Just as the US no longer sees any correlations between agricultural production and GDP, but in India the monsoons and weather patterns are highly correlated with economic growth.
The GS investment strategy using ISM data is summed up by the following graph. If the manufacturing index continues its downward spiral then the length of this lag has been shorter than the median of 11 months with only 5 months. As they say, "Every cycle is unique and return distributions are wide." Caution should be practiced at trying any new strategy, but it does add to the plethora of business cycle investing strategies.
MarketWatch:
ISM: 57.1%
Non-Manufacturing: 54.0%
World-Wide Factory Activity, by Country - Real Time Economics - WSJ
ISM - Media Release: May 2011 Manufacturing ISM Report On Business®
Econoday Report: ISM Mfg Index June 1, 2011
ISM - Media Release: May 2011 Non-Manufacturing ISM Report On Business®
Econoday Report: ISM Non-Mfg Index June 3, 2011
Calculated Risk: ISM Non-Manufacturing Index indicates slightly faster expansion in May
The Capital Spectator: The New Decline In The Inflation Forecast
Chicago PMI Tanks in May - Seeking Alpha
Calculated Risk: ISM Manufacturing index declines to 53.5 in May
David Smith's EconomicsUK.com: Manufacturing growth weakens
American government debt: Mining the safe harbour | The Economist
Mish's Global Economic Trend Analysis: Case-Shiller Nominal and Real Housing Declines Since Peak; Home Prices Best in 25 Years, Better Prices Still Coming
The Capital Spectator: Two More Warning Signs For The Economy
Calculated Risk: Chicago PMI shows sharply slower growth, Manufacturing Activity Expands in Texas
Chicago Business Barometer Shows Weakening Recovery - Real Time Economics - WSJ
The Unkillable Yield Curve Fallacy (Wonkish)
Inflation and Debt (Wonkish)
Inflation Notes
Calculated Risk: Arizona Lands sells for 8 percent of peak price
Misc. Links:
Using the ISM Cycle as an Investment Guide - Seeking Alpha
U.S. Manufacturing Trade (Wonkish){PK}
Supercore! (Wonkish) Two questions about inflation: {PK}
Questions for Minimum Wage Supporters, Bryan Caplan | EconLog | Library of Economics and Liberty
Mish's Global Economic Trend Analysis: Retail Sales Plunge in Italy, Dip Elsewhere in Euro-Zone
Worthwhile Canadian Initiative: Subsidies on Interest Income to increase Aggregate Demand
Bad News In Preliminary Jobs Data
Calculated Risk: ADP: Private Employment increased by 38,000 in May
Why do Depressions Occur?, Arnold Kling | EconLog | Library of Economics and Liberty
Calculated Risk: Employment Summary, Part Time Workers, and Unemployed over 26 Weeks
GOP, Democrats Point Fingers Over Rising Unemployment Rate - Washington Wire - WSJ
Nearly 1 in 3 Unemployed Out of Work More Than a Year - Real Time Economics - WSJ
Video: Weak Jobs Report for May - Real Time Economics - WSJ
Job numbers disapoint and the unemployment rates rises: Is it Time for more stimulus? - The Curious Capitalist - TIME.com
The Capital Spectator: Job Creation Slows Sharply In May
Labels: ISM, Macro-Economics
posted by Ronald Rutherford at 1:54 PM
![]()
![]()


0 Comments:
Post a Comment
<< Home