Monday, March 26, 2012

RSY: XXXXVII: Buy AVCA at $5.59

Advocat Inc. (AVCA) is rated as a Strong Buy by Sabrient for its excellent value and growth scores of 92.9 and 83.8 respectively (top is 100). With less than average market risk it is expected to outperform the market significantly. AVCA's accounting and governance ranks it at the top for conservative practices, which is noted by Sabrient rating AVCA at 82.5 for its Fundamental Score. Beneficial owners have been accumulating positions in this micro-cap stock. Healthcare is a sector that RSY does not have a position in and would help balance the portfolio with this 4% dividend yielding stock.

Since it is a lightly traded stock, RSY recommends buying a small position of 400 shares at a limit price of $5.59 {good for the day}. The ex-dividend date is March 28, so this is a good time to capture a position in it now.

AVCA does not have options available but reviewing our open options shows that the Jun $80 Call for ARLP is down around $0.25 from our 1 option sold at $4.10. The bad news is that ARLP has dropped in price while capturing the option premiums. ARLP is rated a Buy by Sabrient and RSY recommends continuing to hold this position and wait for better prices to sell or covered calls again.

Both TESS and BRKL do not have options available, but are priced so that we can reduce our exposure while capturing some of the capital gains. RSY recommends selling half of each position as such: Sell 200 shares of TESS at $23.01 {GTC} and Sell BRKL 200 shares at $9.51 {GTC}. Sabrient rates BRKL as a Hold presently and TESS as a Buy. This will result in a small gain in BRKL but nearly $2300 in gains from TESS on the 200 shares sold and nearly 100% in gains!


AVCA 4% AI-100% StockScouter 8 Healthcare : Healthcare Facilities
Sabrient rates AVCA a Strong Buy for its excellent value and growth scores.
Value 92.9 Growth 83.8 Sabrient Fundamental Score of 82.5

LFVN-Lifevantage Corporation

Buy!!!
OKS 4.36% 4-28-2018 of $0.61 AI-77 StockScouter 9 Utilities
Growth And Quality Don't Come Cheap At Oneok Partners
Value: A rank of 29.1 for the Sabrient Value Score implies that historical and
projected earnings are already priced into shares of ONEOK Partners.
Balance Sheet: 6.2 YUCK!!!


Sell 1/2 of
BRKL HOLD 400 shares
TESS HOLD 400 shares
No options.
Buy to cover ARLP option.

Sell NLY after April 1st
FCX??? SELL

Labels: , ,

Sunday, March 18, 2012

ISM Non-manufacturing stock picks...

My last post presented 22 Stocks That Perform Well When The ISM Index Goes Up along with some analysis of the ISM reports published in March. The picks were based on the manufacturing index along with 5 of the subindexes (employment, new export orders, new orders, and price). The following list of stocks are based on the most recent ISM report on the non-manufacturing sectors of the economy and the same subindexes. Since the composite/headline index was only added in early 2008, the subindexes were useful in allowing a backtest since early 2000.

As expected the stock picks this time should overlap with the last report as both the non-manufacturing and especially the manufacturing indexes are highly correlated with the overall growth of the economy. Even the backtested annualized returns were the same and above the S&P 1500 flat weighted. At this time, it might also be interesting to see the sector breakdown of the last regression. The sector limit was raised to 30 and some sectors still reached that limit.
Consumer Discretionary 30
Consumer Staples 21
Energy 22
Financials 30
Health Care 16
Industrials 30
Information Technology 3
Materials 25
Telecommunication Services 1
Utilities 26
The table above was just for the last rebalance date but over time there are some observations to notice. The ones that are at 30 (Consumer Discretionary, Financials and Industrials) stayed at the limit the whole time. Those not reaching the limit stayed under the limit and the low ones stayed low. So overall consistent across sectors over the rebalance periods. The two sectors that had the most variance across rebalance dates were Energy and Health Care. While both suffered the most during the spring and summer of 2008, Health Care took it on the chin in the spring of 2000 during the dot-com bust. Below are the picks based on the regression analysis of the non-manufacturing ISM index:
American International Group, Inc. (AIG)
Goodyear Tire & Rubber Company (GT)
The Hartford Financial Services Group, Inc. (HIG)
Principal Financial Group, Inc. (PFG)
Discover Financial Services (DFS)
Prudential Financial, Inc. (PRU)
Wynn Resorts, Limited (WYNN)
MetLife, Inc. (MET)
SunTrust Banks, Inc. (STI)
Coventry Health Care, Inc. (CVH)
Regions Financial Corporation (RF)
Cliffs Natural Resources Inc. (CLF)
Tyson Foods, Inc. (TSN)
Cummins Inc. (CMI)
Mattel, Inc. (MAT)
Marathon Oil Corporation (MRO)
EOG Resources, Inc. (EOG)
Macy's, Inc. (M)
WellPoint, Inc. (WLP)
Devon Energy Corporation (DVN)
Newfield Exploration Company (NFX)

Disclosure:
I have no positions in any stocks mentioned, and no plans to initiate any positions within the next 72 hours.

Disclaimer: This article is published solely for informational purposes and is not to be construed as advice or a recommendation to specific individuals. Individuals should take into account their personal financial circumstances in acting on any rankings or stock selections provided by Sabrient. Sabrient makes no representations that the techniques used in its rankings or selections will result in or guarantee profits in trading. Trading involves risk, including possible loss of principal and other losses, and past performance is no indication of future results.

Labels: ,

Monday, March 05, 2012

A Macro View: ISM Regressions...22

Fair to Middling for Manufacturing, Good News for the Services Sectors
Manufacturing missed the consensus range of 54-55.5% by over 1.5 to 52.4% and well below the consensus point of 54.6%. Economists had predicted a rise in the index of 0.5 but got slack results in all the sub-indexes with new orders down 2.7, production down 0.4, employment down 1.1, supplier deliveries down 4.6, and inventories at break even. But according to Econoday, "... February's rates are respectable and not that much different than January." The most dramatic increase in the sub-indexes was prices with a rise of 6 to 61.5%. So the only good news was the exports index up 4.5 to 59.5%.

Non-Manufacturing ISM Report showed greater strength with the headline index rising 0.5 to 57.3% which was well above the consensus of 56 and on the high side of the consensus range of 54.5-58%. Econoday summary was a little more reasonable by claiming this report was "very positive". Although employment was down 1.7 to a good level of 55.7 and supplier deliveries was down 1.5 to 49.5%, business activity jumped 3.1 to 62.6% and new orders continued its strong upward trend since October 2011 (52.4%) with an increase of 1.8 to 61.2%.

Déjà vu on prices and inflation concerns
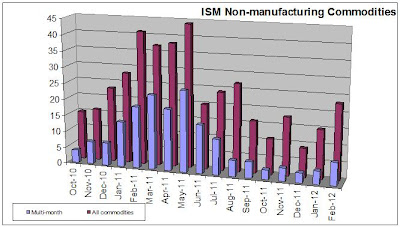
Even though the manufacturing report showed weakness across the board, the price index and numbers of commodities with rising prices did not subside last month. Below is a chart of the price indexes for both manufacturing and non-manufacturing from the Federal Reserve which shows a 5 month trend upward for both sectors.


The following two charts also shows recent upward trends from both reports for both total number of commodities rising in prices and multi-month commodities. It is not nearly as dire as during the spring of 2011. These indexes are not seasonally adjusted so we can expect this recent trend to continue up. It looks more subdued, but that could change during the spring thaws.


Stock Picks Based on Manufacturing Index with Subindexes
The regression formula I used for the following stocks picks included the headline index of the manufacturing index as well as 5 of the subindexes of the manufacturing report (employment, new export orders, new orders, and price) and all within the Fama-French 3 factor model. This creates quite a few regressors and along with raising the limits on sectors and industries, it created longer lists of potential candidates than previous runs. The list of "Lovers" (those that love a rising manufacturing index) was then weeded down to those stocks rated a Strong Buy by Sabrient Systems. (Complete list available upon request.)
Valero Energy Corporation (VLO)
Baker Hughes Incorporated (BHI)
Cummins Inc. (CMI)
Newfield Exploration Company (NFX)
Avery Dennison Corporation (AVY)
Tesoro Corporation (TSO)
WellPoint, Inc. (WLP)
EOG Resources, Inc. (EOG)
Mattel, Inc. (MAT)
Macy's, Inc. (M)
Ford Motor Company (F)
Cliffs Natural Resources Inc. (CLF)
SunTrust Banks, Inc. (STI)
Eastman Chemical Company (EMN)
MetLife, Inc. (MET)
Bank of America Corporation (BAC)
Prudential Financial, Inc. (PRU)
Wynn Resorts, Limited (WYNN)
American International Group, Inc. (AIG)
Discover Financial Services (DFS)
Goodyear Tire & Rubber Company (GT)
Principal Financial Group, Inc. (PFG)


Calculated Risk: ISM Non-Manufacturing Index indicates faster expansion in February

MarketWatch:
Non-manufacturing: 55.5%


Calculated Risk: Existing Home Inventory declines 21% year-over-year in early March

Misc. Links:
The Tax Foundation - U.S. Corporate Income Taxes: Countdown to #1

US Banks Between a Rock and Hard Place: Dodd-Frank and Basel III Compliance | e21 - Economic Policies for the 21st Century

Environmental Economics: The Lorax: An env-econ economist's review

How Entrepreneurship Can Fix Young America. Youth unemployment is a chronic problem across the globe. Entrepreneurship is the answer. | Business | TIME.com

Monetary policy: Try overshooting for once | The Economist

Sectoral rebalancing: The Fed's Reagan recovery | The Economist

Taxation: OPEC and Uncle Sam | The Economist

The Capital Spectator: Will The ISM Services Sector Index's Feb Rise Spill Over To Friday's Jobs Report?

FT Alphaville » A game of krónur

Calculated Risk: HAMP for Investors

David Smith's EconomicsUK.com: Service sector slips but still quite strong

CARPE DIEM: Online Job Demand Improves in February and Supply/Demand Ratio is Lowest Since Nov. 2008

How Much Do Income Taxes Affect Our Behavior? A New Study by Christina Romer and The National Bureau of Economic Research has new answers. | Business | TIME.com

Vital Signs: Incomes Adjusted for Inflation - Real Time Economics - WSJ

How Much Do Income Taxes Affect Our Behavior? A New Study by Christina Romer and The National Bureau of Economic Research has new answers. | Business | TIME.com

Mish's Global Economic Trend Analysis: Disingenuous Recession Explanations from ECRI Regarding Coincident Indicators; An Email Response From ECRI; Does the ECRI Even Believe Its Own Indicators?