Monday, May 23, 2011

RSY XXXVII: No More Gas {EGAS}

Sabrient downgraded EGAS to Sell and thus RSY recommends unloading the remainder of the holdings. Sabrient's analysis states that, "EGAS's weak showing for Sabrient's key growth and momentum measures earns it a Sell rating." Those are troublesome enough facts but also EGAS's Earnings Score and Balance Sheet Score are subpar. RSY recommended opening an initial position of 400 shares based on a $100,000 portfolio on November 15th, and then recommended unloading half on January 13th. RSY suggests placing a sell limit order of the 200 remaining shares of EGAS at $11.19 (GTC) at the opening bell. That should net us a couple of hundred of capital gains for this transaction and around $111 for the last sell and $72 in dividends including the one scheduled for distribution at the end of the month.

Labels: ,

Sunday, May 15, 2011

QEII: The Hyperinflationistas United for the Revolution!

Questioning the Quantitative Easing Monetary Transmission Mechanism or something like that...

A lot of attributes have been assigned to the actions of the Fed, especially with regard to their policy of Quantitative Easing (QE), including but not limited to the rise in commodity prices worldwide, equity markets taking off, worldwide inflation especially in lower income countries, decline in the value of the dollar, domestic inflation rising, and finally reaching the ultimate in a misery index with stagflation. But in all the theories I have read about, there is no mention as to how the money gets from the Fed to the various markets. This might be called the monetary transmission mechanism as Ben Bernanke wrote about in 1995 in a paper entitled Inside the Black Box: The Credit Channel of Monetary Policy Transmission.

Less formally we could at least say how QE transfers the money from a commercial bank to either highly volatile assets like commodities and stocks to simply speculative instruments like futures and derivatives. We do know that the first transfer is that the Fed purchases long-term financial instruments especially government bonds. But then what happens? Do the bankers hand it over to their cousin Vinny to go bet at the Merc? That seems highly unlikely.

Even if there is More Good News as Bank Lending Continues to Rise, that is still a leap to confirm that the monies are ending up in the hands of speculators or investors in the stock markets.

The fact that Commercial and Industrial Loans are increasing at an 8.6 annualized rate is certainly good news for the economy overall. The important question here is where does the money go after the Fed exchanges cash/money for the government bonds? The last phase of quantitative easing dubbed QE2 started in the later part of 2010 and was officially announced in the early part of November. (Graph: Excess Reserves of Depository Institutions (EXCRESNS))

That graph certainly shows a huge increase in reserves since QE2 came about and in the same magnitude of the total amount of QE2 at around $600 billion. Since the first QE started in late 2008 let us look at a longer term graph.

That is probably not every dollar put into the system from QE1 and QE2, but the rise from near zero to over 14,000 billions (1.4 Trillion!!!) of excess reserves covers the majority of the easing as reported. So what are these reserves doing there if not lent out to prospective borrowers? (Interest Rate Paid on Excess Reserve Balances)

I honestly can not answer why the Fed is paying interest on excess reserve balances. But one thing is clear, quantitative easing is mostly or completely absorbed by the excess reserves, thus it is not a monetary transmission mechanism that is causing some markets to expand.

What is the Transmission Mechanism Then?
The most logical transmission is not a transmission of monies but just a simple change in expectations. If prices are to rise in the future then selling in the future is a better option and interest rates will need to rise accordingly now.

Cullen Roche that blogs at Seeking Alpha provides some cogent discussions about QE2. Commodities react almost instantaneously to new information and adapt accordingly, and at "Fed Contributing Directly to Speculative Behavior" he shows how the commodity prices spiked over the Fed Chief’s press conference. Even though he thinks that QE2 was mostly a flop, he states that "A QE3 Would Only Exacerbate Commodities Speculation, Further Curtailing Real GDP Growth". He may have a point going forward and his biggest complaint about QE2 was that it targeted the amount of transactions and not an explicit interest rate target as normal monetary policy is pursued. In other words, long-term bond rates should have been targeted and amount of transactions ignored which would use more of a signaling to the markets than specific transactions in the market.

Hyperinflationistas...
While most of the recent events can be explained by rising corporate earnings or simply supply and demand, I can not help to think that some of the Inflationistas and Hyperinflationistas took their own advice by buying up commodities and investing more in equity markets. The investments in the stock markets is overall a good thing. Commodities might be pushed higher from this frenzied buying, which could in fact create the necessary political will to reduce the structural rigidity this blog has been talking about. And sure enough with gas costs high, Obama to speed oil production.


Why QE2 Was Hardly a 'Non-Event' - Seeking Alpha

The Bond Market's Inflation-Forecasting Abilities - Seeking Alpha

Bank Lending Update: Economic Building Blocks Start Stacking Up - Seeking Alpha

http://krugman.blogs.nytimes.com/2011/05/15/money-1937-slightly-wonkish/

Impact of Fed Stimulus Debated

Federally Funded Friday - Bernanke Says More Free Money! - Seeking Alpha

GDPhursday - Reality Check - How Much is that Priced in Euros? - Philip Davis - Seeking Alpha

The Bernank Says He Is Responsible For Higher Stocks Not Higher Commodity Prices - InTheMoneyStocks.com - Seeking Alpha

The Transmission Mechanism for Quantitative Easing (Wonkish) - NYTimes.com


Quantitative easing and the commodity markets | The Great Debate

Analysis: Fed's QE2 raises alarm of commodity bubble | Reuters

POMO Thursday: Bernanke Serves Up Another Round - Seeking Alpha


Reserves - FRED - St. Louis Fed

Graph: Excess Reserves of Depository Institutions (EXCRESNS) - FRED - St. Louis Fed

FRED Graph - St. Louis Fed

Interest Rate Paid on Excess Reserve Balances (Institutions with 2-Week Maintenance Period) (INTEXC2) - FRED - St. Louis Fed

Excess reserves - Wikipedia, the free encyclopedia

The Fed initially announced a $600 billion program in November 2008, but then four months later, increased that to $1.8 trillion, when it wasn't enough.

QE1: Nov. 2008-June 2010
QE2: Nov. 2010-June 2011 (estimation)


From RDRutherford:
QE2's Failure and the Housing Market - Seeking Alpha


An Event Study on the Fed and QE2 - Seeking Alpha

The Impact of the Fed's Stimulus Is Debated - Seeking Alpha
Impact of Fed Stimulus Debated


Fed Survey: Big Banks Ease Lending Standards - Real Time Economics - WSJ
Quote:
�The most often cited reason for stronger demand noted by larger banks was greater demand for financing merger and acquisition activity,� the Fed said.

Banks, citing increased competition, eased standards on commercial and industrial loans. �Some banks that had eased standards and terms also pointed to a more favorable or less uncertain economic outlook,� the Fed said.

Demand for commercial real-estate loans also increased, the Fed said.


Structural Rigidity: War, Counterror Act Like Sand in Economic Gears - Real Time Economics - WSJ

Calculated Risk: Fed: Banks more willing to make consumer loans

Fed�s Hoenig: Rates Should Start Rising - Real Time Economics - WSJ

Fed�s Rosengren Says Recovery Weak, Policy Just Right - Real Time Economics - WSJ

The Fed's Language Problem on Inflation - NYTimes.com

Labels: ,

Friday, May 13, 2011

RSY XXXVI: Are You Getting 100%? More TOT{al} to RSY.

As the title asks, "Are You Getting 100%?"-- of Total. On the other hand, TOTAL S.A. (TOTAL) has been taking it on the chin from nearly $64.5 recently to a low today below $57 even though their next ex-dividend date is quickly approaching on May 18th with a sizable dividend of $1.577 per share. Although oil prices are sagging somewhat lately, it is still maintaining above average prices at close to $100/barrel. And TOT has not stopped venturing into all energy sources including taking majority stake in SunPower that "designs, manufactures and markets high-performance solar electric power technologies." Sabrient recently upgraded TOT from Buy to StrongBuy.

Overall, there seems to be no reason to back away from this long-term investment. Since there is nothing to discourage our faith in the company and even one commentator has recently labeled TOT as the Perfect Safe Haven, then RSY is recommending adding more to the current recommended position of 100 shares with 100 more (based on $100,000 portfolio). RSY recommends a limit order at $57.51 good for the day. You may want to adjust that price if it does not trade in the opening minutes.

This may turn out to be a short-term trade. Having multiple lots does provide more flexibility to hedge and trade with swing movements.

Tuesday, May 10, 2011

RSY XXXV: Optional Options

Just as selling into a strong market is good, selling covered options in a strong bull run is beneficial. Before we look into some possible choices for selling covered calls on our portfolio, let us look at the latest Sabrient ratings for our rated positions.

Since there is no rush to unload any specific position, RSY portfolio would like to pick longer term contracts to make it worthwhile. Some of the positions do not have options available. Just like the adage says to make money by selling high and buying low, we want to pick out options to sell that are above their theoretical value and buy back below their theoretical value. RSY rejected Total (TOT) for that reason.

Just as RSY recommends good-til-cancelled (GTC) limit orders for buys and sells, RSY suggests the same for option orders. Some of the possible options that could be fruitful are:
1. STMICROELECTRONICS (STM) OCT-11 $12.50 CALL, 6 option contracts at limit price of $1.20.
2. FOOT LOCKER INC COM (FL) JAN-12 $22.50 CALL, 2 option contracts at a limit price of $2.45.
3. COMPASS DIVERSIFIED HOLDINGS (CODI) NOV-11 $17.50 CALL, 2 option contracts at a limit price of $0.75.
4. INVESCO MORTGAGE CAPITAL (IVR) OCT-11 $30.00 CALL, 2 option contracts at a limit price ofoption contracts at a limit price of $0.45.

Labels: ,

Sunday, May 08, 2011

Macro View: ISM April, Downers but Net Up For Manufacturing

While the Manufacturing ISM Report showed general weakness in the indexes and an overall drop in the PMI, the Non-Manufacturing ISM Report showed a significant drop in the headline NMI index as well as a dramatic drop in new orders. Mike Shedlock {Mish} noticed that Manufacturing ISM Prices Paid Hits Another High, Up 22nd Consecutive Month and that Non-Manufacturing ISM Plunges Below Prediction of All 73 Economists, New Orders Collapse, Prices Firm.

Both headline numbers dropped with the NMI dropping 4.5 and the PMI decreasing 0.8%. The manufacturing was above the consensus with MarketWatch and Econoday Report {ISM Mfg Index} both at 59.5 and Econoday stating the consensus range of 58 to 60.5%. So while the NMI stayed on the high side of expectations, the PMI was significantly below the consensus of MarketWatch at 57.8 and Econoday {ISM Non-Mfg Index} at 57% with a range of 54.5 to 60%. Whenever the actual is outside of the consensus range, then that is a significant event. Either the basis of the analysis is faulty or unexpected events were not considered in making the estimates.

Spin or Happiness Pills?
The non-manufacturing report noted some strong negative index numbers such as: a 6 point drop in business activities index to 53.7%, a dive in the new orders index by 11.4 to 52.7, employment index approaching the 50% mark also by dropping 1.8 to 51.9%, and new export orders dropping 5.5 to 53.5%. Thus it is curious as to how Anthony Nieves of the ISM stated the following about the report.
Respondents' comments are mixed about overall business conditions; however, they are mostly positive. Respondents' comments also indicate concern over rising fuel costs, commodity costs and the lingering uncertainty about the economy. {Emphasis added.}


As Mish noted above in the manufacturing sectors, prices paid for inputs are rising and getting much worse. The one bright spot was that the non-manufacturing sectors index dropped 2 points but still maintained above 70 at 70.1%. Manufacturing added a little more fuel to the fire with a 1/2 point increase to the highest level since July 2008 at 85.5%. Last month all 18 industries from both reports reported increases in prices. This month is not much better as all 18 in non-manufacturing and 17 in manufacturing reported higher prices. The lone exception was one industry reporting no change in prices. Also the percentage of respondents reporting higher prices to those reporting lower prices continues to climb. For non-manufacturing it is 57:2 ratio and for manufacturing it is 72:1 ratio. Meaning that for every manufacturing respondent that said they were paying lower prices there were 72 others stating they were paying higher prices. That clearly is an unsustainable path.

Let us look at some of the published comments from respondents that Anthony mentions above.
Non-Manufacturing:
# "Fuel prices continue to be challenging and in addition to shipping, are influencing the cost of materials." (Public Administration)
# "We are seeing price increases in many areas, and the lead times are stretching out. Our business activities are improving at a moderate rate." (Wholesale Trade)
# "Looking forward with reserved caution. Cost of goods by this fall are a big worry." (Accommodation & Food Services)
Manufacturing:
# "Rapidly rising raw material costs putting extreme pressure on profits." (Food, Beverage & Tobacco Products)
# "Plastic resin product prices are climbing so fast that [suppliers] are attempting to increase prices on orders already accepted but not [yet] delivered." (Chemical Products)
# "Customers are rebuilding safety stock levels of inventory, and also trying to buy ahead of material price increases." (Plastics & Rubber Products)

The last comment above should be a red flag in regards to growth of the economy or inflation going forward. While on the one hand this increases aggregate demand and increases production for inputs especially, but on the other hand this could be a sign that inflation expectations are unmoored. It certainly is not the time to scream HYPERINFLATION, but not sure that Paul Krugman can continue to be so sanguine about inflation expectations.

Looking at commodity prices also paints the continuing concerns about inflation. No commodities had lower prices in either report. Non-manufacturing had slight reductions in total commodities rising in price at 38 and commodities with consecutive months at 19. Manufacturing continued going up for both categories with 39 total commodities reported as rising in prices and 30 having consecutive months which was a rise from 22 in March up from 21 in February and 15 in January.

Norbert J. Ore {ISM Manufacturing Report} also seems to be smoking whatever Nieves was when he wrote the following.
Ore stated, "The past relationship between the PMI and the overall economy indicates that the average PMI for January through April (61 percent) corresponds to a 6.5 percent increase in real gross domestic product (GDP). In addition, if the PMI for April (60.4 percent) is annualized, it corresponds to a 6.3 percent increase in real GDP annually."

But the U.S. Commerce Department’s Bureau of Economic Analysis stated that real GDP grew 1.8 percent at an annual rate. If the non-manufacturing sectors were also maintaining above 60% levels like manufacturing then maybe the above analysis might be closer to the truth.

The Bright Spot...Manufacturing
Even though the important index numbers of new orders, production, and employment showed weakness with a decrease of 1.6, 5.2, and .3 percentage points respectively, the "net" percentage of respondents increased in all three indexes. For new orders the percentage of respondents stating that it was better was 49 versus 8% worse with a net of 41% and the month before saw numbers of 43 better off and 10% worse off with a net of 33. That trend has been continuing since November 2010 when the net was 5% (30 to 25). Last month's percentages for production were 43 better and 5 worse for a net of 38. This trend also started in November 2010 with a net of 6 divided between 26 better and 20% worse. And lastly, employment index trend started in December with a net of 10 and 22 higher and 12% lower. Last month employment was 34 higher and 5 lower for a net of 29%.

The importance of this is that even if the index contracts some, this might be beneficial in the long run as the economy needs as broad a base to absorb all the excess labor currently. Of course without non-manufacturing this will still be hard for the economy to get back on a productive employment path. This brings us to one of the most important indexes in the reports {at least for now}: non-manufacturing employment index. As noted already, the index dropped 1.8 to 53.7% and the trend seems to be headed back down below the 50% mark. The nets are improving {March 22-13=9, April 26-11=15} but with lower levels of expansion then this is not likely to be of much benefit in employment numbers. Below is what the recent trends show since the index lows of December 2009. (Click on charts for clearer images.)

The trend line slope declined almost 11% for last month and over 14% for the past two months. This could be a new downward trend in employment for the non-manufacturing sectors indicating contraction in employment. Let us hope not.

More about the Demise of Manufacturing Myth
With the upcoming Presidential election season starting soon enough, there is bound to be candidates that espouse how to save the manufacturing sectors of the US economy. Trump's China-bashing is one example we have already. Mark J. Perry at Carpe Diem presents some important graphs in some of his recent posts to dispel the fear of the "manufacturing demise". Below is value added by industry over time {CARPE DIEM: Service Sector Inflation Remains Mild}.

That just confirms that the manufacturing sector is adding less to the US GDP over time, but he also brings up some important points that the services sectors of the economy has not been creating a vicious cycle of inflation in the economy and are unlikely to in the future. His conclusions are as follows.
MP: I've made some of these same points before. In the inflationary 1970s, almost every measure of prices was increasing: food, energy, core inflation, wages, services, interest rates, etc. We now have a wide mix of inflationary, deflationary and flat inflationary forces, along with decelerating wage increases and low interest rates, and that's not a formula that results in overall inflationary pressures. At least not yet. And since inflation for services has been below 2% for almost two years now, there's not inflationary pressure there.

That seems to be the case for now, but it is doubtful that when every industry in both manufacturing and non-manufacturing are experiencing increases in the commodity inputs that there will be no eventual pass-through price increases, even if wage inflation is low or non-existent for now. {CARPE DIEM: The "Decline or Demise" of U.S. Farming?}

The US and the world economy has already experienced the demise of agriculture. One way to describe the graph above is that we are past the agricultural society which took humans around 10,000 years to accomplish. Now we are in the dying days of the industrial society. What develops from now is anyone's guess. It is defined above graphically as a services society but that is likely to be broken down into specific components like finance, health, education etc.

The last graph above most importantly shows that it is not the US lagging in manufacturing production but in fact we are the leader to the new economies of the future. The US is at the "undiscovered country" and there is no turning back, even if we wanted to. {CARPE DIEM: "Decline of Manufacturing" is Global Phenomenon: And Yet the World Is Much Better Off Because of It}


To be, or not to be - Wikipedia, the free encyclopedia

Star Trek VI: The Undiscovered Country - Wikipedia, the free encyclopedia


Calculated Risk: Weekly Initial Unemployment Claims sharply higher

Economics - What America makes


MarketWatch Forecasts:
ISM: 59.5%
Non-Manufacturing: 57.8%


David Smith's EconomicsUK.com: Three in a row as service sector slows


Calculated Risk: ISM Non-Manufacturing Index indicates sharply slower expansion in April
This was well below expectations of 58.0%.


Calculated Risk: ISM Indexes and BLS Payroll Employment

David Smith's EconomicsUK.com: Slower manufacturing growth, modest retail sales

Calculated Risk: Texas Manufacturing survey shows slower expansion in April

Calculated Risk: ISM Manufacturing at 60.4 in April

Inflation: The commodity-price speed limit | The Economist

Calculated Risk: Household Formation and the "Big L"

The Capital Spectator: The March Rebound

Mish's Global Economic Trend Analysis: Gallup: U.S. Job Creation At Post-Recession High; What's Next? How Congress Can Spur Job Creation

Real Time Economics - Search Results

Calculated Risk: ADP: Private Employment increased by 179,000 in April

CARPE DIEM: Michigan, Rust Belt States Lead Economic Recovery

CARPE DIEM: Jobless Claims Spike Due to Seasonal Adjustment?

Calculated Risk: Clear Capital Home Price Index shows Double Dip

The Capital Spectator: Initial Jobless Claims Surge To 8-Month High

Calculated Risk: Q1 2011 Details: Investment in Office, Mall, and Lodging, Residential Components

Calculated Risk: LPS: Mortgage Delinquency Rates declined in March, Foreclosure pipeline "Bloated"

Calculated Risk: Consumer Sentiment increases slightly in April compared to March

Calculated Risk: Construction Spending increased in March

Economic Indicators: Is Three a Trend? - The Curious Capitalist - TIME.com


Misc. Links:
Calculated Risk: Survey: Small-Business Lending Is Increasing

The Impact of the Fed's Stimulus Is Debated - Seeking Alpha


Trade: Boeing, Boeing, gone | The Economist

Calculated Risk: Home Sales: Distressing Gap

New Home Sales: Slightly Better Than Horrible - The Curious Capitalist - TIME.com

Whatever Happened To The Housing Recovery?

After the Fall(s) - NYTimes.com

Mish's Global Economic Trend Analysis: Ron Paul asks "When is Bernanke Going to Admit Fed Policy is a Total Failure"

Q&A: IMF’s Anoop Singh on Inflation in Asia, China Trade and Dangerous Capital Flows - Real Time Economics - WSJ

The Two-Track Recovery (or 'Depression'?) - NYTimes.com

Calculated Risk: Restaurant Performance Index increases in March

Let’s Talk Ham and Eggs «  Modeled Behavior

How Can Retirees Determine a Sustainable Withdrawal Rate? - Fama/French Forum

Mish's Global Economic Trend Analysis: Silver Plunges 12%, What's Going On?

Dow Jones Sentiment Indicator Rebounds - Real Time Economics - WSJ

Inflation: Are commodity prices heading down? | The Economist


Reckonings - That Sinking Feeling - Op-Ed - NYTimes.com

The Plight of the MBA Generation - Doug French - Mises Daily

Hard Keynesianism - NYTimes.com

Economics - How to beat Dr Evil Unemployment!

http://krugman.blogs.nytimes.com/2011/05/01/money-talks-regulation-walks/
http://krugman.blogs.nytimes.com/2011/05/01/faminedeath-2012/
http://krugman.blogs.nytimes.com/2011/05/02/a-commodity-peak/
http://krugman.blogs.nytimes.com/2011/05/01/on-not-reading-keynes/
EconoSpeak: Did Keynes Support Having a "Central Plan"

Labels:

Sunday, May 01, 2011

MacroView: Paul Krugman: WEITW, Elephant in the Room on Discussions Concerning Public/Private Employee Pay

This year has brought forth the meme that public sector employees are paid more than their counter-parts in the private sector. Certainly the center of this debate has concentrated on Wisconsin and of course the Governor Scott Walker. The Economist sums up some of the points at Wisconsin public unions: Don't join the government to get rich. The most obvious point is that some career choices have monetary consequences, and clearly top corporate lawyers can make a ton of money and vastly beyond district attorneys. But I think most people consider a lot of the non-monetary aspects of jobs also when deciding which career to pursue, like working environment, job security, stress levels, safety, job turnover, and of course under the constraints of the individual's innate abilities and interests.

The Economist links to a study by Jeff Keefe at the Economic Policy Institue which has been at the forefront of defending public sector employees as not being overpaid. In these types of studies, instead of comparing similar jobs, they compare workers across education levels, experience, hours of work, organizational size, gender, race, ethnicity and disability. Aside from education levels, the rest of the factors are not mentioned as being significant.

This raises two issues with education levels of public employees. First, as the studies themselves point to there is not equality in job titles/responsibilities. Thus the pay scales for education majors in like music, history, English, etc is indeterminate but not likely to be at the same level as public employees. Second, there are various reasons to believe that the government relies more heavily on education as requirements for a job than the private sector would. In the desire to be non-discriminatory, it is easier to use education credentials during recruitment to weed out the possible candidates to a reasonable pool than it is to use more subjective requirements and tests.

If in fact people are over-educated for the jobs they receive through the government, then this is not simply a matter of government budgets paying for those unneeded levels of education but also a dead-weight loss to society. Instead of resources {human resources} going to the most productive sectors of the economy, they get diverted to bureaucracy. For example, foreign aid often diverts skilled, educated labor into administering aid instead of the creation of an entrepreneurial class.

The Economist magazine goes on to make another important point that government employees feel entitled to the pensions plans that the unions and government agreed to and reneging on that is grossly unfair. Truly we should feel sympathetic to their plight, but there are questions that the bargaining is not between two diametrically opposed interests. A good way to describe this relationship is from Mark Perry at Carpe Diem who quotes Katherine Kersten (The Vicious Cycle of Government Unions).
Here's the vicious cycle: Union leaders take money from union dues and pass it to Democratic candidates. Once elected, the politicians "negotiate" with the unions that helped elect them. In essence, the unions hire their own bosses who face them across the bargaining table.

Politicians repay unions' financial support by doling out hefty pensions and benefits. It's easy to be generous when you're spending taxpayers' money, not your own. Elected officials aren't accountable to a board of directors or shareholders, and they don't have to worry about going bankrupt, as private companies do.

Not that private firms don't do it, but clearly there is a tendency to push benefits into the future. Most of the reports seem to overlook what the discount rate is for calculating net present value of future benefits. It seems conceivable that public employees might have a lower discount rate than the general population. This would mean that future payments have more value than present, and that government should use that lower rate to calculate present benefits. That would then lead to lower benefits currently.

Paul Krugman also sides with the unions, surprise, surprise, surprise. At his post The Contribution Scam, he quotes David Cay Johnston. They both feel that pensions and the benefits package come out of the workers "pay" as that was negotiated in the contracts, and supposedly the government workers would earn more than they could have if benefits were lower. The difference is whether public employees are judged by their productivity to society. In a private firm, yes there can be overpaid employees, but unlike in the fairy tales of Dilbert, competition pushes inefficient producers out. What mechanism will push government to use its resources (human capital) in the most efficient manner?

The Economist article ends with a discussion about unions being a form of monopoly market power and questions then why don't they earn even more than their counter-parts in private institutions. From the discussion above and some data below, there is in fact some questions as to whether the public employees are being taken advantage of. One reason the Economist gives is that government is a "monopoly employer" especially concerning specialized jobs that do not have equals in the private sectors. This may be just a blog post at the Economist, but the correct term is that the government is a monopsonist employer. A monopsonist is a market participant that is the sole or nearly the sole buyer of a product or service. Government being in that position, it could extract higher levels of productivity and thus create more social good, but that has not happened. Inefficiencies in government have persisted. When a monopolist sells to a monopsonist, then who captures the rents is indeterminate and falls mostly to the one that that can capture political influence.

So What is the Elephant in the Room?
Other than entrepreneurs and risk takers in society, most middle class people desire to work in government. This is mostly anecdotal experiences for myself, but nothing seems to counter that for the average worker they deeply desire to work for the government. The task of social scientists like economists is to determine why. One of the best ways to determine what people want most, is to see how they "vote with their feet". This does not tell us the benefits from moving to a new location like the US or another state or just a new job, but it does tell us that the benefits exceed the opportunity costs from staying at present location.

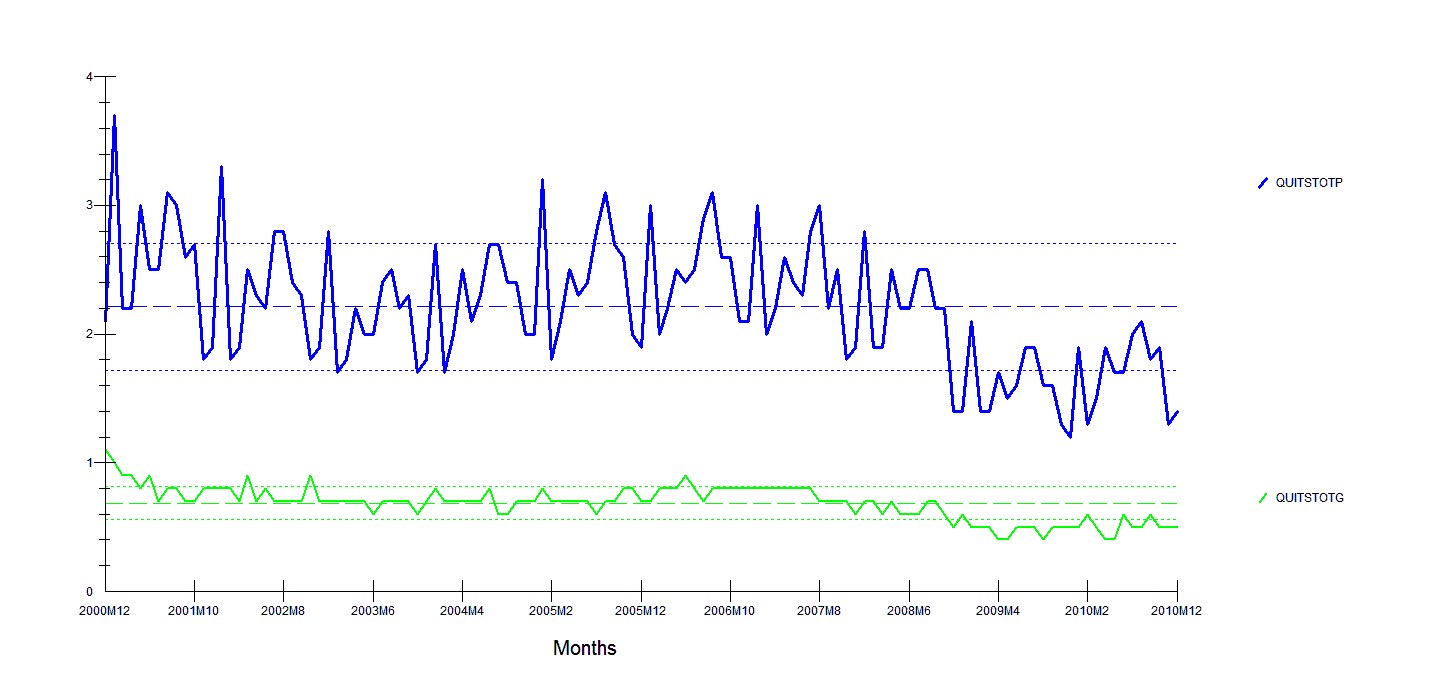
So what data points might tell us how people are voting with their feet? Job openings do not tell us how the prospective employee is reacting in the market, but quits and separations tell us the rate of them leaving the job. Ideally, we would also want to see number of applicants per job announcement or some other number to show the desire of prospective employees to be hired. The graph below is the rate of total separations for private and government employees, and the second is the rate of quits for both sectors. Both are from the Federal Reserve Bank of St. Louis over the last ten years.


Just for comparisons, I also include the two sets of data with the origin at zero and include the mean and one standard deviation for all four series.


Some things to note on the graphs are: since the last recession started separations and quits have been declining for both private and public employees as more are staying on the job longer; total separations for government employees spiked up because of the census workers laid off but still maintained its below average rate; volatility as measured by standard deviation is much greater for private employees and most dramatic for quits; and private employees always face higher rates of separation and always quit at higher rates than public employees with even the massive separations from the census workers only reduced the difference marginally. Even though the evidence clearly shows that government employees have the lowest turnover rates, we must be cognizant that there may be a selection bias happening here. That is, those that desire jobs that have less turnover would also have the ability to fit into an organization for the long-term. Those that desire long-term job stability would also have traits that allow them to stay on the job long-term.

Conclusions
Clearly, government workers stay much longer at their job and have the lowest turnover rates. They feel very content at their jobs and are not leaving or quitting which tells us that the job benefits are of greater value to them than the alternatives. A priori reasoning suggests that the benefit package that government employees get is greater than what the private sector provides. These benefits are beyond just pay checks and benefits but stability of their jobs and overall work and working conditions. It was calculated that this lower turnover rate amounts to around a 12% pay raise. That would be a subjective determination from each individual employee as to the value of this factor along with what individual's discount rate would be. The Heritage Foundation uses utility functions to calculate this additional benefit for increased job security and conclude that it could be as high as 15% of pay for California Public Employees {Are California Public Employees Overpaid? | The Heritage Foundation}.
However, properly accounting for retiree health benefits and defined-benefit pension plans generates a public compensation premium of around 15 percent. The additional job security granted to public-sector employees is equivalent to an approximately 15 percent increase in public compensation, meaning that the total public-sector pay premium in California may be as high as 30 percent.


Maybe whether they are overpaid or not is immaterial as they are benefiting more than others that are suffering in this economic recession. Governments could be using their monopsonist market powers to extract either higher rates of productivity or lower rates of pay/benefits or both.

If state and local governments are to balance their budgets then pay of public employees must be considered as it consumes about 44% of state and local spending. At some time, productivity of public workers must be considered. Education is the biggest single category of public employees and thus productivity of teachers will have to be addressed also.


Misc. Links:
http://www.cato.org/pubs/tbb/tbb-59.pdf

http://www.cato.org/pubs/journal/cj30n1/cj30n1-5.pdf

Job Security Differences

Recession of 2008 Exposed True Cost of Public Employee Unions | Tad DeHaven | Cato Institute: Commentary

Government Sector Unions-Becker - The Becker-Posner Blog


Mish's Global Economic Trend Analysis: Gallup: U.S. Job Creation At Post-Recession High; What's Next? How Congress Can Spur Job Creation


Five Things You Might Not Know About Public Employees presents some facts that important to figuring out how to balance government budgets.


Arnold Kling on Government Wages | Rortybomb

Mortality and Lifetime Income: Evidence from U.S. Social Security Records

Quits (Levels and Rates) - FRED - St. Louis Fed

Total Separations (Levels and Rates) - FRED - St. Louis Fed

Wisconsin public versus private employee costs: Why compare apples to oranges? Jeffrey H. Keefe February 15, 2011

Unions: Bob Barro's Mistaken Analogy, David Henderson | EconLog | Library of Economics and Liberty

What’s wrong with ‘right-to-work’: Chamber’s numbers don’t add up
Does ‘right-to-work’ create jobs? Answers from Oklahoma

Mish's Global Economic Trend Analysis: Goldman's Blood-Sucking Leeches Model, Money Multipliers, Macroeconomic Dark Ages, the Taylor Rule, and Nonsense from Trichet

Mish's Global Economic Trend Analysis: Paul Krugman, Stephen Colbert, Bill Maher, others, Ignore Extortion, Bribery, Coercion, and Slavery; No One Should Own You!

Caught: Krugman's Shifting Arguments - Robert P. Murphy - Mises Daily

Calculations:
How to Calculate Default Risk Ratio | eHow.com

A Simplified Method for Calculating the Credit Risk of Lending Portfolios

Volatility Definition - How to Calculate Volatility
How to Calculate Volatility | eHow.com

How to Calculate Sharpe Ratio | eHow.com

Labels: ,