Sunshine on a Cloudy Day..
ISM Manufacturing index shows expansion, as stock markets open the year in strong fashion, and the
service industries expanded in December at the fastest pace since May 2006, showing the U.S. economic recovery is picking up and broadening beyond manufacturing. Econoday also stated the following summations about the reports:
ISM Mfg Index
All in all, this is a very positive report, one confirmed by strength in regional data and one pointing to New Year strength for the nation's manufacturing sector.
ISM Non-Mfg Index
The nation's businesses, at least based on the ISM's sample of roughly 350 companies, continue to do more with less. Today's report points to strong growth for the economy that will, hopefully sooner than later, trigger new hirings. There's little initial reaction to this report.
What's the Good News?There were certainly plenty of things to be upbeat on both reports. The headline numbers came in well above the 50% break even point with manufacturing (PMI) showing 57% and non-manufacturing (NMI) at 57.1%. This last month signified near complete convergence as the NMI gained 2.1% and PMI of just .4%. The NMI showed consistent growth since last August with a low of 51.5%. The manufacturing index was just short of the consensus by .2% for Econoday and .5% by MarketWatch, but well within acceptable levels for the consensus range of 55.5 to 58.6% for Econoday. Non-manufacturing index was significantly above the consensus of 55.6 for MarketWatch and 55 for Bloomberg News and 56% for Econoday, and also beating the consensus range of 55 to 57%.
Not only did the headline numbers grow last month but even larger increases came in the new orders index and the business activities index. For manufacturing, the production index jumped 5.7% to 60.7% and the new orders jumped 4.3% to 60.9%. For non-manufacturing, the business activities index made significant gains of 6.5% to 63.5% and the new orders jumped 5.3% to 63%. All numbers were above 60 and showing broad strength especially in the non-manufacturing sectors as 14 out of the 18 reporting industries showing growth in both categories.
Dr. Mark J. Perry at Carpe Diem
noted that "
The 63.5 percent reading for the ISM Non-Manufacturing Business Activity Index in December was the highest monthly level since August 2005, more than five years ago."
Raindrops Keep Fallin' on My Head.
Structural rigidity is still of major concern as the converging of price indexes is occurring at such a high level, over 70. Manufacturing bumped up 3 to 72.5% which was the highest since May 2010s reading of 77.5%. Also scary is that no manufacturing industries reported lower prices and 14 out of 18 reported higher. The percentage of respondents reporting lower prices was 3% and higher was 48%, thus signifying like 16 respondents reported higher prices for every one reporting lower. Non-manufacturing made a larger jump of 6.8 to 70%. A high not seen for a long time. The ratio of respondents with lower costs to higher costs was 1 to 7.
Commodities in short supply was not a significant problem last month, but industries are reporting more commodities are rising in prices. Non-manufacturing sectors had no change on the multiple months of specific commodities (7) but the total number of commodities rose to 23 from 16 in November. The big concern going forward is that the manufacturing sectors showed a large increase in new commodities with rising prices of 23 commodities from 16 in November, and multiple months nearly doubled from 8 in November to 15 in December's report.
A business may be able to compensate for price anomalies of a single month, but multiple months will lead to margins being reduced and eventually prices being passed onto the consumer. So far, the US has not experienced inflation in the last decade, but these are not positive signs. One other factor is that as the US dollar continues its long term trend downward in value, then at some point the "pass-through" costs of this currency devaluation will affect importers and they will begin raising prices. Both domestic and foreign competitors will know this and be more willing to raise prices as margins are squeezed.
New export orders also showed weakness on both reports with manufacturing dropping 2.5 to 54.5% and non-manufacturing dropping 3.5 to 56%.
Working in the Coal MineMost disappointing of all was the non-manufacturing employment index as it dropped 2.2 to 50.5%. We had seen a growth trend and possible breakout from the stagnant 50% line, but it failed again at maintaining a steady growth trend. (Click on tables for clearer images.)

The trend line during December 2009 until December 2010 was very close to 0.5% per month with a R-squared of 0.5825. This meaning that the majority of the rise was related to later months than earlier months with an increase of almost one-half percent increase per month. But if we are expecting the services industries to bring us back to full employment then this is clearly too low, even if the trend continues.
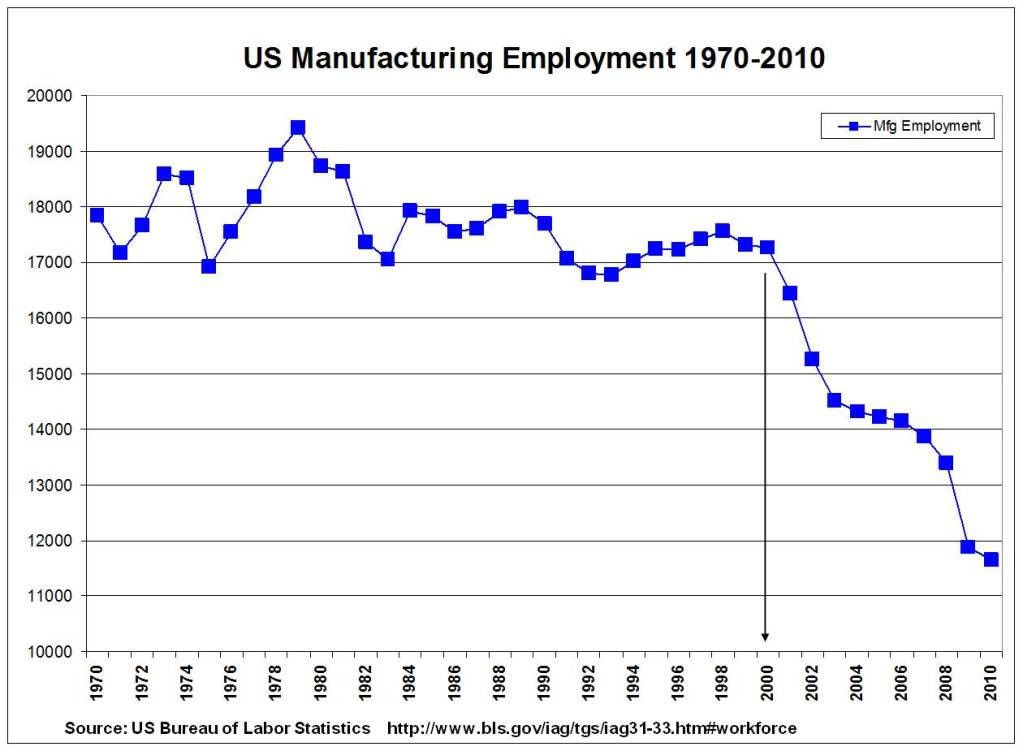
Manufacturing employment index also dropped 1.8 but still maintained its mid 50s range at 55.7%, and the trend set since a high in October of 57.7% is trending down. Surprisingly, Mike Shedlock just discovered that, "
The long-term trend suggests it would be a mistake to expect too many jobs out of manufacturing." Mish provides a chart of employment in manufacturing (2000-2010), and for a longer time frame I include the following chart (From
Manufacturing Employment.)
 'Where Do We Go From Here' {Employment}
First came news that the ADP
report says 297,000 jobs added last month which is the highest gain on record. And this led to increased estimates for the BLS report for last Friday to the "median forecast rising to 150,000". But there were
caveats behind the strong ADP report.
But there is a seasonal quirk in the ADP number that may have inflated the December number. ADP and Macroeconomic Advisers do a seasonal adjustment that takes into account a typical December purge, where employers who have fired workers over the course of the year but don’t remove them from officials payrolls right away clear the rolls.
Ben Herzon of Macroeconomic Advisers explains: “If companies were laying off fewer employees throughout 2010 than had been the case in recent years, the amount by which the seasonal adjustment process subtracted from [ADP National Employment Report] growth last year through November was too great. Following the same logic, fewer layoffs through November implies fewer December purges than in recent years, so the boost to December employment growth to offset the normal December purge may have been too large.”
Then sure enough the BLS stated the following in their report at
THE EMPLOYMENT SITUATION – DECEMBER 2010 {PDF}.
The unemployment rate fell by 0.4 percentage point to 9.4 percent in December, and nonfarm payroll employment increased by 103,000, the U.S. Bureau of Labor Statistics reported today. Employment rose in leisure and hospitality and in health care but was little changed in other major industries.
Even with the latest drop in the employment rate, it did not reach my prediction last January. At that time I stated,
"I think headline unemployment percentage will slowly creep down over the next year to 9% and continue on that trend for the next couple of years." at
Hawks Eating Humble Pie.
Mike Shedlock provides a
jobs growth forecast for 2011 from Calculated Risk vs. Mish . Their predictions are as follows:
Calculated Risk:
This suggests to me that private payroll employment will increase by over 2 million jobs next year, maybe as high as 3 million jobs! My guess is around 2.4 million jobs as shown on the following graph.
Mish's Global Economic Trend Analysis:
I come up with +127,000 private jobs a month in comparison to Calculated Risk's estimate of +200,000 jobs a month. That is quite a difference.
I have total nonfarm jobs at +106,000.
Mish thinks that government employment will shrink by about 21,000 per month, or he is just dreaming a little about "hope and change". Mish comes to those conclusions mostly based on general trends over 2010. This might be good for a rough estimate but it may underestimate expanding sectors as they become the engine of growth in a turnaround economy. Paul Krugman takes a different approach by considering what growth rates would be needed to lower unemployment levels at
The Long Road Ahead.
Roughly, it takes two point-years of extra growth to reduce the unemployment rate by one point.
So, suppose that US growth is accelerating. Even so, it will take years of high growth to get us back to anything resembling full employment. Put it this way: suppose that from here on out we average 4.5 percent growth, which is way above any forecast I’ve seen. Even at that rate, unemployment would be close to 8 percent at the end of 2012, and wouldn’t get below 6 percent until midway through Sarah Palin’s first term.
Interesting set of data points and also shows one of Krugman's deepest fear; that the business cycles will go against the Democrats and the Obama administration over the next few years with the Sarah Palin crack. That is, the economy will be still down and thus Palin wins the 2012 election and then during her first term provides growth prospects that insure reelection of her in 2016.
"Karl Smith" counters this line of reasoning by considering that high levels of unemployment now could easily translate to higher growth rates than what the US has been traditionally at
Unemployment and Growth. This higher growth rate is derived from the "massive reservoir of untapped labor which could be easily mobilized". But the US has always had a massive reserve of untapped labor and that has been traditionally fulfilled by larger participation rates and immigration. This immigration has come from both legal as in the case of H1B visas and other special visas, and of course illegal immigration. The bigger problem is a matching problem of the skills that the massive reservoir of unemployed have presently and the skills of the new work force. Of course the structural rigidity of the US could prevent quick changes in the movement of capital from one sector to another.
Conclusion:I am not certain that the time to panic about rising prices is upon us yet, but clearly there are signals that the Fed should be considering a change in the direction of monetary policy going forward. They need to be proactive and plan well in advance of changes in price levels. Even if unemployment is too high, they may need to start unwinding the monetary stimulus instruments. Under normal economic environments, fiscal and monetary policies should coordinate. But under situations like stagflation, then there may be a need for divergence between the two. Much as the early 1980s saw very restrictive monetary policy along with what could be considered fiscal stimulus.
Not only is manufacturing expanding in the US, and in the
UK with a new 16-year high of 58.3 (more at
UK Economy 2011), and in
China where PMI expands, but momentum slows, but also
"global manufacturing ended the year on a strong note". Only Japan and Greece were contracting out of the 23 countries listed, and 15 countries were experiencing raising index levels including Japan by 1%. While this is of course good for worldwide economic growth, it does portend that commodity prices could start to rise even more this year.
References:ISM - Media Release: December 2010 Manufacturing ISM Report On Business®ISM - Media Release: December 2010 Non-Manufacturing ISM Report On Business®MarketWatch Data:
Manufacturing ISM Forecast: 57.5%
Non-Manufacturing Forecast: 55.6%
Supply Chain News: Are Manufacturers Really bringing Back Work to US? Anecdotes and some Data Say Yes – Even as Trade Deficits with China Rise; US Now has Total Cost Advantage in Some Areas, GE Executive SaysISM Non-Manufacturing Index showed expansion in DecemberMisc. Links:Fed Watch: A Solid Start To 2011Manufacturing activity rises to 7-month highThe Plight of American Manufacturing Since 2001, the U.S. has lost 42,400 factories -- and its technical edge.ManufacturingEmployment-1-1-1 ABQtomUnlike Immigrants, Robots Will Permanently Drive Down Real WagesLabor Market Commentary Arnold KlingThe Recalculation Story: A Summary Arnold KlingADP: +270k Jobs in Dec., Largest Gain on RecordTrade innovation: Invented threats | The EconomistAn Interview with Robert Barro: "The Lessons from the Great Depression"The Risk of Rising Oil and Gas PricesSci-Fi:Robin Hanson on the technological singularityTime to Read "Less Than Zero"http://www.iea.org.uk/sites/default/files/publications/files/upldbook98pdf.pdf
Migration wages: more evidenceI reckon there are three policy implications here.
1. A cap on highly skilled immigration is a stupid idea.
2. Insofar as emigration reduces the wages of stayers, there is more reason to worry about the possibility that higher incomes taxes might encourage high earners to migrate. Fortunately, there is - so far? - little sign of them doing so, but this weakens a little my prior support for higher taxes.
3. It’s important to ensure that the capital stock can adjust upwards in response to immigration. Exactly how to do this is of course a matter of debate: is it more important to maintain aggregate demand and get banks lending, or to reduce red tape and capital taxes and barriers to entrepreneurship? Whatever the answer, the question becomes a little more important.
http://www9.georgetown.edu/faculty/ludemar/Wage%20effects_ozden.pdf
Labels: ISM, Macro-Economics, Structural Rigidity


